Tag: Plant Reliability

  • Plant Life Extension: Strategies for Extending the Life of Aging Industrial Plants

    Plant Life Extension: Strategies for Extending the Life of Aging Industrial Plants

    Most industrial plants are designed for a finite life, typically 20 to 40 years depending on the industry, the equipment and the design basis. Many plants operate well beyond that. Equipment is replaced, systems are upgraded, and the plant continues to produce. Others reach a point where life extension is no longer economic, and replacement becomes the better option.

    Plant life extension (PLEX) is the process of assessing, planning, and executing the work needed to keep an aging plant operating safely, reliably, and economically beyond its original design life. It is a strategic decision that affects capital investment, operating cost, safety, and regulatory compliance.

    For small to medium-scale industrial plants, life extension decisions are especially important because there is less redundancy and fewer resources to absorb the consequences of a wrong decision. Extending the life of a plant that should be replaced wastes money. Replacing a plant that could be extended safely wastes capital.

    This article covers the key considerations in plant life extension, from assessment to execution.

    What Is Plant Life Extension?

    Plant life extension is the set of activities required to continue operating a plant beyond its original design life while maintaining safety, reliability, and compliance.

    It is worth separating two terms. Design life is the period the plant was originally designed and analyzed for. Useful life is how long the plant can actually operate safely and economically. Design life is a starting assumption, not a hard limit. Some equipment fails earlier because of poor operation or maintenance, and well-maintained equipment often lasts much longer.

    Life extension is not simply “keeping the plant running.” It involves:

    • Assessment: Evaluating the condition and remaining life of equipment and systems.
    • Planning: Identifying what work is needed and when.
    • Investment: Funding the required repairs, replacements, and upgrades.
    • Execution: Performing the work, often during turnarounds.
    • Monitoring: Tracking performance and condition over time.

    Life extension can range from a few years of incremental work to a major program of replacement and upgrade.

    Why Life Extension Matters

    Life extension decisions have significant consequences.

    Factor Impact of Good Life Extension Impact of Poor Life Extension
    Safety Equipment maintained within safe limits Aging equipment creates safety risks
    Reliability Failures managed before they occur Increasing failures and unplanned outages
    Cost Capital deployed where it adds most value Money wasted on the wrong equipment
    Compliance Regulatory requirements met Non-compliance, fines, or forced shutdown
    Production Output maintained or improved Declining performance and output
    Business case Investment justified and returns achieved Poor returns; capital stranded
    Insurance and financing Insurers and lenders confident in the plant’s condition Higher premiums, restricted cover, or difficulty financing

    For small plants, life extension is often the main alternative to building a new plant, which may be prohibitively expensive.

    The Case for Life Extension

    Life extension is often justified when:

    • The plant is in good condition: Equipment has been well maintained.
    • The remaining life is sufficient: The plant can operate for years with targeted investment.
    • Replacement is expensive: Building a new plant is not economically viable.
    • Demand exists: The plant’s output is still needed.
    • Regulatory compliance is achievable: The plant can meet current and foreseeable requirements.
    • Upgrades add value: Efficiency, capacity, or flexibility improvements justify investment.

    Life extension is not always the right choice. Sometimes replacement is better, especially if the plant is in poor condition, compliance is not achievable, or demand is declining.

    The Case Against Life Extension

    Life extension may not be justified when:

    • The plant is in poor condition: Equipment is degraded beyond economic repair.
    • Compliance is not achievable: The plant cannot meet current or foreseeable regulations.
    • Replacement is cheaper: The cost of life extension, including the risk of future outages, exceeds the cost of a new plant.
    • Demand is declining: The plant’s output is no longer needed.
    • Technology is obsolete: Spare parts, expertise, and support are unavailable.
    • Safety risks are unacceptable: The plant cannot be operated safely.

    The decision requires an honest assessment of both the plant and the business case.

    Key Drivers of Plant Aging
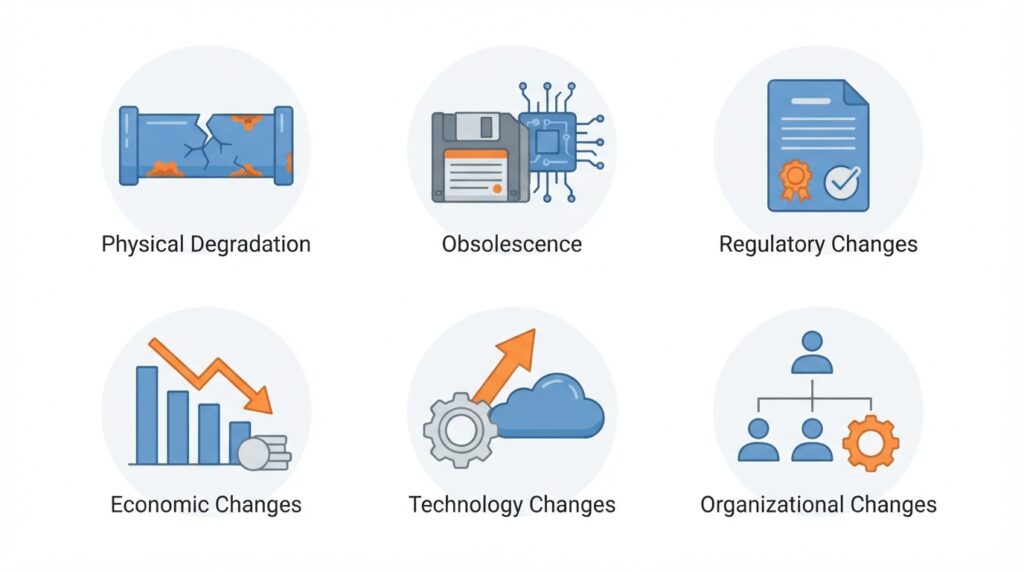
    Key drivers of plant aging in industrial plants

    Plants age for several reasons.

    Driver Description Examples
    Physical degradation Wear, corrosion, fatigue, erosion, and other damage mechanisms Pipe wall thinning, bearing wear, refractory degradation, creep in high-temperature piping, thermal fatigue, embrittlement, hydrogen damage
    Obsolescence Technology no longer supported Control systems, instrumentation, spare parts
    Regulatory changes New or stricter requirements Emissions limits, safety standards
    Economic changes Market, fuel, or cost changes Fuel price increases, competition
    Technology changes New technology makes old obsolete More efficient equipment, digital controls
    Organizational changes Loss of expertise, changing priorities Retirement of experienced staff

    Understanding which drivers apply to your plant helps focus life extension efforts. Physical degradation is the one most people think of first, but obsolescence and organizational change can cause problems sooner than expected.

    Assessing Remaining Life

    The first step in life extension is assessing the condition and remaining life of equipment and systems.

    Method Description Application
    Condition assessment Physical inspection and testing Piping, vessels, structures
    Remaining life analysis Engineering calculations based on condition Pressure vessels, piping, turbines
    Failure history review Analysis of past failures and repairs All equipment
    Performance testing Measuring current performance Turbines, compressors, heat exchangers
    Obsolescence review Identifying equipment at risk of obsolescence Control systems, instrumentation
    Compliance review Identifying regulatory gaps All systems

    Assessment should cover all major equipment and systems, not just the most visible ones. It also depends on good records. Original design data, as-built drawings, operating history, inspection reports, and repair records are the baseline against which condition is judged. If they are missing or unreliable, rebuilding them is the first job of the assessment.

    Design Basis and Code Gap Review

    A plant built 30 years ago was designed to the codes, standards, and practices of that time. Before committing to life extension, compare the original design basis with current requirements. Common gaps include pressure equipment codes, fire protection and electrical standards, safety instrumented system requirements, structural and seismic criteria, and environmental limits.

    Not every gap must be closed. Legal requirements for older plants vary by jurisdiction and by whether the work is a modification or a continuation of existing operation. A documented gap review helps the owner and the regulator agree on what must be upgraded, what can be justified by other measures, and what is acceptable as is. Skipping this review is a common way for hidden compliance costs to surface mid-program.

    Fitness-for-Service Assessment

    Fitness-for-service (FFS) assessment evaluates whether equipment with known defects or degradation can continue to operate safely. Standards such as API 579-1/ASME FFS-1 provide methodologies for assessing remaining strength and life. FFS is especially useful for pressure equipment with corrosion, cracking, or wall loss. It can show that equipment is acceptable as is, acceptable with a reduced operating envelope or a shorter inspection interval, or in need of repair or replacement. That often avoids unnecessary replacement and supports a defensible decision.

    Risk-Based Inspection

    Risk-based inspection (RBI) prioritizes inspection based on the likelihood and consequence of failure. It helps direct limited inspection resources to the equipment that matters most. Recognized practices such as API 580 and API 581 provide the framework. For small plants with limited inspection budgets, RBI helps ensure the highest-risk equipment gets the most attention while low-risk items are inspected less often.

    Using Remaining Life in Maintenance Planning

    Remaining life assessment should feed directly into maintenance planning and drive decisions: equipment approaching the end of its remaining life should be scheduled for replacement or refurbishment, not just monitored. Remaining life estimates are not fixed. They should be updated as new inspection data, operating history, and changes in operating conditions become available.

    Inspection, Testing, and Monitoring Techniques

    Remaining life estimates are only as good as the data behind them. Common techniques include:

    Technique Typical Use
    Visual and remote inspection (borescope, drones, crawlers) Vessels, tanks, stacks, boilers, hard-to-reach areas
    Ultrasonic thickness and flaw detection Wall loss, cracking, weld quality
    Radiography and magnetic particle / dye penetrant testing Welds, surface cracks
    Metallurgical methods (hardness, replication, sampling) Creep damage, embrittlement, material degradation in high-temperature service
    Vibration, thermography, oil analysis Rotating equipment, electrical connections, lubrication condition
    Electrical testing (insulation resistance, partial discharge, transformer oil analysis) Transformers, motors, cables, switchgear
    Structural surveys and concrete/steel testing Foundations, pipe racks, buildings, stacks
    Online and continuous monitoring Tracking trends between inspections

    Where data is limited, inspect more or use more conservative assumptions. For equipment with significant temperature or pressure cycling, track accumulated damage (starts, stops, and load changes), because operating history consumes life as well as calendar age.

    Critical Equipment and Systems

    Some equipment and systems are more critical to life extension than others. Common critical items include:

    • Pressure vessels and piping: Subject to corrosion, fatigue, creep, and regulatory inspection.
    • Rotating equipment: Turbines, compressors, pumps, and motors.
    • Boilers and heat exchangers: Subject to fouling, corrosion, and thermal fatigue.
    • Electrical systems: Transformers, switchgear, motors, and cables, including insulation aging.
    • Control systems: Often the first to become obsolete.
    • Structures and foundations: Subject to corrosion and structural degradation.
    • Safety systems: Must be maintained and updated to current standards.
    • Long-lead and non-redundant items: Equipment that is hard to replace quickly or whose failure stops the whole plant.

    Critical items should be assessed first and in more detail. A useful way to rank them is by combining the consequence of failure (safety, environment, production, cost) with the likelihood of failure based on condition.

    Equipment-Specific Life Considerations

    Equipment Typical Life-Limiting Mechanisms Typical Life Extension Actions
    Boilers and heat recovery equipment Tube wall loss, creep, thermal fatigue, fireside and waterside corrosion Tube replacement, header and weld inspection, water chemistry improvement
    Steam and gas turbines Creep, low-cycle fatigue, erosion, blade damage Major overhauls, component replacement, rotor life assessment
    Pressure vessels and piping Corrosion, cracking, creep (high temperature), fatigue FFS assessment, repair, re-rating, replacement of sections
    Pumps, compressors, motors Wear, vibration, bearing and seal failure, insulation aging Refurbishment, rewinding, re-rating or replacement
    Transformers and switchgear Insulation degradation, contact wear, moisture Testing, oil treatment, refurbishment, replacement
    Control and instrumentation Obsolescence, component failure Phased or full migration to modern systems
    Structures and foundations Corrosion, concrete deterioration, settlement Surveys, repair, strengthening, protective coatings

    This table is a starting point. The right actions depend on the equipment’s condition and duty.

    Life Extension Strategies
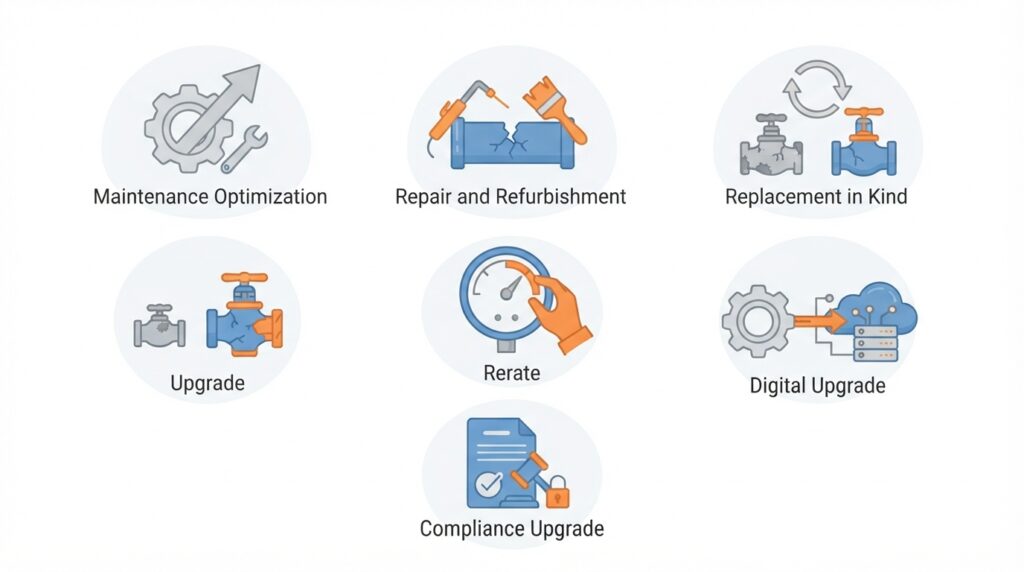
    Life extension strategies for aging industrial plants

    Several strategies can be used to extend plant life.

    Strategy Description When to Use
    Maintenance optimization Improve maintenance to extend equipment life When equipment is in reasonable condition
    Repair and refurbishment Repair or refurbish degraded equipment When repair is cheaper than replacement
    Replacement in kind Replace with identical or equivalent equipment When the original design is still suitable
    Upgrade Replace with improved equipment When improvements justify investment
    Rerate Increase capacity or efficiency When demand or economics justify
    Digital upgrade Modernize controls and monitoring When obsolescence is a concern
    Compliance upgrade Meet new regulatory requirements When regulations require it

    A rerate changes the conditions the plant was designed for, so pressure relief, piping, electrical, and control systems must be rechecked against the new operating envelope.

    Strategies can be combined. A life extension program may include maintenance optimization, targeted replacement, and control system upgrades. Any change to equipment, design, or operating conditions should go through a formal management of change (MOC) process. Major work should be followed by a pre-startup safety review (PSSR) before the plant returns to service.

    Planning Life Extension

    Life extension should be planned as a program, not a series of individual projects.

    Planning elements:

    • Objectives: What is the target life extension (for example, 10 years or 20 years)?
    • Scope: What work is required to achieve the objectives?
    • Schedule: When will the work be performed?
    • Budget: What is the cost, and how will it be funded?
    • Resources: Who will do the work, and what skills are needed?
    • Risk: What are the risks, and how will they be managed?
    • Approvals: Who approves the plan, and what is the process?

    Planning should begin well before the plant reaches the end of its original design life. Many owners find a staged approach practical:

    1. Screening: A high-level review of condition, compliance, obsolescence, and economics to decide whether life extension is worth pursuing.
    2. Detailed assessment: Inspection, testing, remaining life analysis, and FFS work on critical equipment.
    3. Program definition: Scope, schedule, budget, and risk plan based on the assessment.
    4. Execution: Work performed in a controlled way, usually during turnarounds.
    5. Monitoring and review: Condition and performance tracked, and the program updated as findings change.

    Staging lets the owner stop early if the screening or assessment shows that replacement is the better option, before large sums are spent.

    Spare Parts Strategy

    Life extension programs should include a spare parts strategy. Parts for aging equipment may have long lead times or may be obsolete, and should be identified and procured well before they are needed. A good strategy identifies critical spares, reviews what is in stock, checks supplier availability, and decides which parts to buy now, which to source on demand, and which to replace through upgrades. It should be built into the program budget from the start, not discovered when a failure occurs.

    Life Extension and Turnarounds

    Turnarounds are often the best opportunity to perform life extension work.

    Advantages:

    • The plant is already shut down.
    • Access to equipment is available.
    • Contractors and resources are mobilized.
    • Work can be coordinated with other maintenance.

    Considerations:

    • Turnaround scope may need to be expanded.
    • Planning must begin earlier.
    • Budget must be secured in advance.
    • Work must be sequenced with other turnaround activities.
    • Long-lead items must be ordered well before the shutdown.

    Life extension work that is not done during a turnaround may require a separate outage, which adds cost and lost production. Turnaround inspection findings should also feed back into the remaining life assessment.

    Executing Life Extension: Contracting, Contingency, and Quality

    Life extension work differs from new construction because the full scope is not known until equipment is opened up. This affects how work should be organized:

    • Scope growth is normal. Discovery work (additional repairs found during inspection) should be expected. Budgets and schedules need larger contingency than for comparable new work, and contracts should say how additional scope is priced and approved.
    • Phase the work. Early phases (inspection and assessment) can confirm scope before major purchases or contracts are committed.
    • Control quality. Materials, welding, and repair procedures should meet applicable codes, with traceability and qualified personnel. Repairs to aging equipment often involve older materials, so compatibility and welding procedures need care.
    • Plan restart carefully. After major work, a PSSR, commissioning checks, and performance testing confirm the plant is ready and that expected benefits were achieved.
    • Choose the delivery model deliberately. Depending on the owner’s own engineering capability, the work may be self-managed, split among specialist contractors, or given to an EPC contractor.

    Life Extension and Obsolescence

    Obsolescence is one of the biggest challenges in life extension.

    Common obsolescence issues:

    • Control systems: Older systems may no longer be supported.
    • Instrumentation: Older instruments may be discontinued.
    • Spare parts: Parts may no longer be available.
    • Software: Older software may not run on modern platforms.
    • Expertise: Fewer people know how to maintain older systems.

    Obsolescence strategies:

    • Identify at-risk items: Which equipment is at risk of obsolescence?
    • Last-time buy: Purchase spare parts before discontinuation.
    • Alternate sources: Identify substitute parts or suppliers.
    • Upgrade: Replace obsolete equipment with modern equivalents.
    • Reverse engineering: Manufacture equivalents when needed, with attention to material qualification, quality, and intellectual property.
    • Redesign: Modify systems to use available technology.

    Obsolescence should be addressed proactively, not reactively.

    Digital Upgrades and Cybersecurity

    Replacing obsolete control systems usually brings networked, software-based equipment into the plant. This improves monitoring and reliability, but it also brings cybersecurity risk that older standalone systems did not have. A digital upgrade should include network segmentation, access control, patch management, backup and recovery, and training for operations and maintenance staff.

    Life Extension and Regulatory Compliance

    Regulatory requirements often drive life extension decisions.

    Common regulatory issues:

    • Emissions limits: New or stricter limits may require equipment upgrades.
    • Safety standards: New standards may require safety system upgrades.
    • Inspection requirements: Older equipment may require more frequent inspection.
    • Environmental requirements: New requirements may affect water, waste, or emissions.
    • Operating permits and licenses: Some jurisdictions require formal review or renewal to operate beyond the design life.

    Compliance strategies:

    • Identify gaps: What requirements does the plant not currently meet?
    • Assess options: What are the options for achieving compliance?
    • Plan upgrades: When and how will upgrades be performed?
    • Monitor changes: Keep track of regulatory developments.

    Compliance should be addressed as part of the life extension program, not as a separate effort.

    Safety and Risk Review

    Life extension must not only keep the plant running but also keep its risk acceptable. Aging increases the likelihood of some failures, and changes made during life extension can introduce new risks.

    Good practice includes:

    • Revalidating hazard studies (such as HAZOP) for the plant as it now exists, including past modifications.
    • Reviewing safety systems. Check that relief devices, alarms, interlocks, and safety instrumented functions still meet their required performance, and re-verify them where components are replaced or conditions have changed.
    • Reviewing fire protection and emergency response against the current plant layout and inventory.
    • Controlling work hazards. Older plants may contain hazardous materials such as asbestos, lead paint, or PCB-containing oil, which require proper handling during repair and demolition.
    • Maintaining a risk register that tracks aging-related risks and the actions taken to manage them.

    People and Knowledge

    Aging plants often come with an aging workforce. Experienced operators and maintenance staff know the quirks of the plant, the history of repairs, and the workarounds that keep it running. When they retire, that knowledge leaves with them. A life extension program should capture this knowledge through documented procedures, interviews, and training of newer staff. It should also make sure the skills needed for upgraded systems, such as modern control systems and condition monitoring, are available.

    Contracts, Permits, and Commercial Alignment

    Technical life must match commercial life. Before committing capital, confirm that the extended operating period is supported by:

    • Operating permits and licenses valid for the extended period.
    • Offtake or supply agreements (for example, power purchase agreements or product supply contracts) that run long enough to recover the investment.
    • Land, lease, and site rights that extend to the planned end date.
    • Insurance and financing terms consistent with the plan.

    A plant that is technically sound but has no contract or permit beyond the next few years may not justify major investment.

    Economic Analysis

    Life extension decisions should be based on economic analysis.

    Analysis elements:

    • Capital cost: What is the cost of the life extension work?
    • Operating cost: How will operating costs change?
    • Revenue: What revenue will the plant generate?
    • Remaining life: How long will the plant operate after extension?
    • Alternatives: What are the alternatives (replacement, shutdown)?
    • Risk: What are the risks, and how are they valued?

    Analysis methods:

    • Net present value (NPV): Present value of future cash flows minus investment.
    • Internal rate of return (IRR): The discount rate at which NPV equals zero; a measure of return on investment.
    • Payback period: Time to recover the investment. It is easy to understand but ignores the time value of money and what happens after payback.
    • Levelized cost of product: Cost per unit of output over the plant’s life. For power plants this is the levelized cost of electricity (LCOE).

    When comparing alternatives with different lives, such as extending for 10 years versus building a plant that lasts 30, use a method that puts them on a comparable basis, such as equivalent annual cost. Include the cost of outages, the cost of risk, and decommissioning costs in the comparison. The economic analysis should be honest and comprehensive. Optimistic assumptions can lead to poor decisions.

    Decision Framework: Extend, Partially Replace, Replace, or Retire

    Life extension is rarely a yes/no decision. A practical framework considers a range of options:

    Option When It Fits
    Extend as is, with maintenance optimization Condition is good and risks are manageable
    Targeted repair and replacement Most equipment is sound; specific items limit life
    Major refurbishment or rerate Core equipment is sound and added capacity or efficiency adds value
    Replace with a new plant or unit Condition, compliance, or technology makes extension uneconomic
    Mothball or retire Demand, economics, or safety no longer support operation

    Compare options on the same basis: cost, risk, performance, schedule, and what happens at the end. An exit plan for decommissioning, including cost and responsibilities, belongs in every option, because life extension only postpones that obligation, and a realistic end date makes the economics more honest.

    Common Mistakes in Life Extension

    Even experienced organizations make mistakes. Common ones include:

    • Deferring assessment: Waiting until problems occur.
    • Underestimating scope: Discovering more work than expected.
    • Underestimating cost: Budget overruns.
    • No contingency for discovery work: Treating inspection findings as a surprise instead of an expectation.
    • Ignoring obsolescence: Discovering too late that parts are unavailable.
    • Ignoring compliance: Discovering too late that regulations have changed.
    • Ignoring commercial limits: Investing in a plant whose permits, contracts, or site rights end soon.
    • Optimistic assumptions: Overestimating remaining life or revenue.
    • Poor records: Making decisions without reliable design, inspection, or repair data.
    • Treating safety as a side issue: Not revalidating hazards and safety systems after years of change.
    • Overlooking cybersecurity: Adding networked controls without protecting them.
    • Skipping MOC and PSSR: Making changes without proper review.
    • No plan: Performing work reactively instead of strategically.
    • No follow-through: Failing to complete planned work.

    These mistakes can turn a viable life extension into a failed program.

    How Japanese EPC Firms Approach Life Extension

    Japanese engineering firms are often noted for a disciplined approach to plant life extension. Common characteristics include:

    • Thorough assessment: Equipment condition and remaining life are assessed carefully.
    • Detailed planning: Life extension is planned as a program, not a series of projects.
    • Conservative assumptions: Remaining life and performance are typically estimated conservatively.
    • Comprehensive documentation: Assessment, planning, and execution are documented.
    • Disciplined execution: Work is performed as planned, with tight control.
    • Long-term focus: Life extension is treated as an investment in the plant’s future.

    For plant owners, this often means life extension programs that deliver the intended results.

    How to Evaluate Life Extension Readiness

    When considering life extension for your plant, ask:

    Question Why It Matters
    Has equipment condition been assessed? You cannot plan without knowing condition
    Has remaining life been estimated, and is it kept up to date? Determines how long the plant can operate
    Are design, inspection, and repair records reliable? Decisions depend on good data
    Has the design basis been compared with current codes? Identifies hidden compliance costs
    Have fitness-for-service and risk-based inspection been considered? Supports defensible decisions on degraded equipment
    Have hazard studies and safety systems been revalidated? Keeps risk acceptable as the plant ages
    Has obsolescence been reviewed? Identifies equipment at risk
    Is there a spare parts strategy? Prevents delays from long lead times
    Has compliance been reviewed? Identifies regulatory gaps
    Do permits, contracts, and site rights cover the extended life? Ensures investment can be recovered
    Is there a life extension plan? Provides a roadmap for the work
    Is the economic case sound, with alternatives compared fairly? Justifies the investment
    Is there an exit plan for decommissioning? Makes the economics realistic
    Are turnarounds planned to include life extension? Provides the opportunity to perform work
    Is knowledge being captured from experienced staff? Protects against loss of expertise
    Is there a process for monitoring and adjusting? Keeps the program on track

    A plant that addresses these questions is ready to plan and execute life extension.

    Key Takeaways

    • Life extension keeps aging plants operating safely, reliably, and economically beyond design life
    • The decision requires an honest assessment of both the plant and the business case
    • Design life is a starting assumption, not a hard limit; useful life depends on condition and operation
    • Key drivers of aging include physical degradation, obsolescence, regulatory changes, and loss of knowledge
    • Reliable records and a design basis and code gap review are the foundation of assessment
    • Remaining life assessment is the foundation of life extension planning, and it should feed directly into maintenance planning
    • Fitness-for-service assessment (for example, API 579) and risk-based inspection help focus effort and avoid unnecessary replacement
    • Plan life extension as a staged program; staging allows early exit if replacement is the better option
    • Strategies include maintenance optimization, repair, replacement, upgrade, and compliance upgrade, all under MOC and followed by PSSR
    • Turnarounds are often the best opportunity to perform life extension work
    • Obsolescence and compliance should be addressed proactively, including a spare parts strategy and cybersecurity for digital upgrades
    • Revalidate hazards and safety systems; life extension must keep risk acceptable
    • Technical life must be supported by permits, contracts, and site rights
    • Capture knowledge from experienced staff before it is lost
    • Economic analysis should be honest and comprehensive and include alternatives, risk, and end-of-life costs
    • Japanese EPC firms emphasize thorough assessment and disciplined planning

    Conclusion

    Plant life extension is a strategic decision that affects safety, reliability, cost, and compliance. For small to medium-scale industrial plants, it is often the main alternative to building a new plant.

    By assessing condition and remaining life, planning as a program, addressing obsolescence and compliance, and executing disciplined work, owners and operators can extend the life of their plants safely, reliably, and economically.

  • Plant Reliability Engineering: Key Concepts and Practices

    Plant Reliability Engineering: Key Concepts and Practices

    Reliability is not an accident. It is the result of deliberate design, disciplined maintenance, and continuous improvement. Plants that operate reliably for decades do so because reliability was engineered into them, not because they were lucky.

    Reliability engineering is the discipline of understanding why equipment fails and applying that knowledge to prevent failures. It combines design, maintenance, operations, and data analysis into a single approach focused on keeping the plant available, efficient, and safe.

    For small to medium-scale industrial plants, reliability engineering is especially valuable because there is less redundancy and fewer resources to absorb failures. A reliability-focused approach helps direct limited resources where they have the greatest impact.

    This article covers the key concepts and practices of plant reliability engineering, from basic definitions to practical implementation.

    What Is Plant Reliability?

    Reliability is the probability that equipment or a system will perform its intended function without failure for a specified period under specified conditions.

    In practical terms, reliability means:

    • Equipment works when needed.
    • Equipment works as designed.
    • Equipment continues to work over time.
    • Equipment works safely.

    Reliability is not the same as availability, although the two are related.

    Term Definition Example
    Reliability Probability of performing without failure over a period 90% probability of running 8,000 hours without failure
    Availability Percentage of time equipment is available for operation 95% available over a year
    Maintainability Ease and speed of restoring equipment after failure Average repair time of 4 hours
    Relationship Availability depends on both reliability and maintainability High reliability and fast repair give high availability

    Availability depends on both how often equipment fails (reliability) and how quickly it is restored (maintainability). A pump that fails rarely but takes three weeks to repair can have worse availability than one that fails more often but is fixed in hours.

    Why Reliability Engineering Matters

    Reliability directly affects plant performance.

    Factor Impact of High Reliability Impact of Low Reliability
    Production Consistent output; commitments met Unplanned outages; lost production
    Cost Predictable maintenance; lower emergency costs High repair costs; premium purchases
    Safety Fewer failures; fewer incidents Failures create safety hazards
    Efficiency Equipment performs as designed Degraded performance; higher fuel cost
    Reputation Customer confidence maintained Lost customers; damaged reputation
    Morale Team pride in a reliable plant Firefighting culture; burnout

    Unplanned failures are also usually the most expensive kind. They bring lost production, expedited parts, overtime labor, and often collateral damage to other equipment. For small plants, where redundancy is limited, reliability is not optional. It is essential.

    Key Reliability Concepts

    Reliability engineering uses several fundamental concepts.

    Concept Definition Application
    Failure rate Frequency of failure over time Predicts how often equipment will fail
    MTBF Mean time between failures (repairable equipment) Average operating time between failures
    MTTF Mean time to failure (non-repairable items) Expected life of items replaced rather than repaired
    MTTR Mean time to repair Average time to restore equipment
    Inherent availability MTBF ÷ (MTBF + MTTR) Percentage of time equipment is available, excluding planned maintenance
    Failure mode How equipment fails Identifies how failures occur
    Root cause Fundamental reason for failure Prevents recurrence
    Bathtub curve Failure pattern over equipment life Guides maintenance strategy

    Worked example. A feed pump has an MTBF of 2,000 hours and an MTTR of 4 hours. Its inherent availability is 2,000 ÷ 2,004, or about 99.8%. If repairs took 40 hours instead, availability would drop to about 98.0%. This shows how much repair time matters.

    A common misunderstanding. MTBF is not the expected service life of equipment. If failures occur randomly at a constant rate, only about 37% of units will still be running after operating for a period equal to the MTBF. MTBF is a statistical average across a population, not a guarantee for an individual machine.

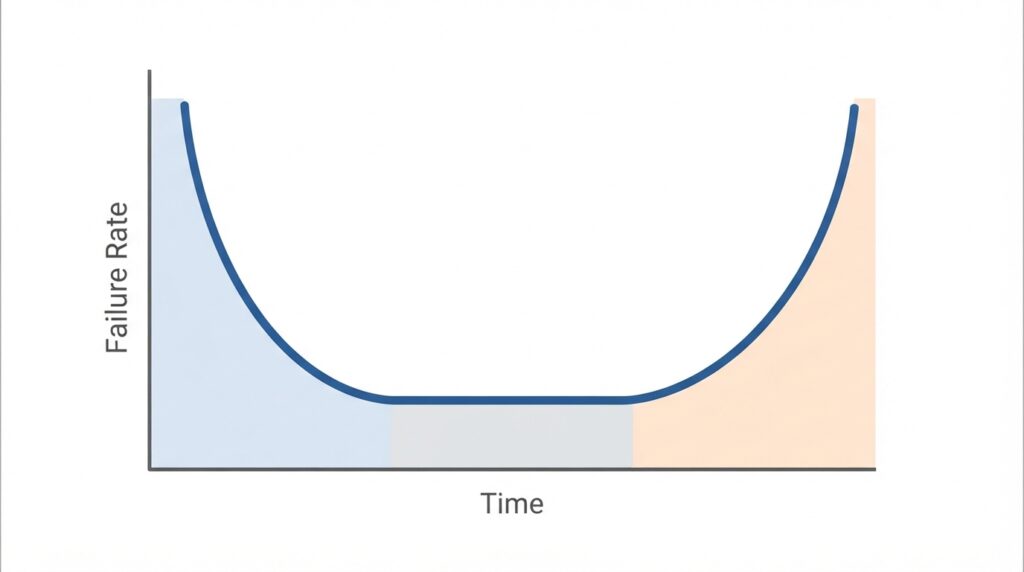
    The Bathtub Curve

    Bathtub curve for equipment reliability in industrial plants

    The bathtub curve describes one common failure pattern over an equipment’s life.

    Phase Failure Pattern Causes Maintenance Strategy
    Early life (infant mortality) High failure rate, decreasing Manufacturing defects, installation errors Commissioning, burn-in, quality control
    Useful life Low, roughly constant failure rate Random failures Condition monitoring and condition-based tasks
    Wear-out Increasing failure rate Aging, wear, fatigue Overhaul, replacement, increased monitoring

    Understanding where equipment is on the curve helps select the right maintenance strategy.

    An important caveat. The bathtub curve is a useful model, but it is not universal. Studies of failure patterns, most notably the aviation work behind reliability-centered maintenance, found that only a minority of components follow it. Many show infant mortality followed by a long, flat, random-failure period with no clear wear-out. For equipment with random failures, time-based overhauls do not reduce failures and can even introduce new ones through maintenance-induced errors. This is why condition-based approaches and failure data analysis matter.

    Reliability vs. Maintenance

    Reliability and maintenance are related but distinct.

    Aspect Reliability Engineering Maintenance
    Focus Preventing and reducing failures through design, analysis, and improvement Preserving equipment function and restoring it when it is lost
    Timing Design, operation, and after failures (to prevent recurrence) Scheduled, condition-based, and after failure
    Approach Analysis, design change, and improvement Inspection, servicing, repair, and replacement
    Goal Eliminate or reduce failures Keep equipment in service and minimize downtime
    Discipline Reliability engineering Maintenance management

    Reliability engineering asks, “How do we prevent this failure?” Maintenance asks, “How do we keep this equipment working, and how do we fix it quickly when it stops?” Both are necessary, but reliability addresses the root of the problem.

    Reliability Engineering Activities

    Reliability engineering involves several core activities.

    Activity Purpose When Applied
    Reliability prediction Estimate failure rates and reliability During design
    Reliability block diagrams Model system reliability and identify weak points During design and modification
    Criticality analysis Rank equipment by consequence of failure Design and operation
    FMEA Identify failure modes and effects During design and operation
    RCM Determine maintenance requirements Design and operation
    RCA Investigate failures and prevent recurrence After failures
    Condition monitoring Detect developing failures During operation
    Reliability testing Verify reliability through testing During design and commissioning
    Data analysis Track and analyze failure data Continuously
    Reliability improvement Implement changes to improve reliability Continuously

    These activities work together to build and maintain reliability.

    Reliability Block Diagrams (RBD)

    Reliability block diagrams (RBDs) model how components are arranged in a system, in series, parallel, or a combination, to calculate overall system reliability. They help identify where redundancy improves reliability and where single points of failure exist.

    • Series arrangement: All components must work for the system to work. System reliability is the product of component reliabilities. Two pumps in series, each with a reliability of 0.95, give a system reliability of 0.95 × 0.95 = 0.9025.
    • Parallel arrangement: The system works if at least one component works. Two parallel pumps, each with a reliability of 0.95, give a system reliability of 1 − (0.05 × 0.05) = 0.9975.

    The comparison shows two things. In a series arrangement, every added component lowers system reliability. In a parallel arrangement, redundancy raises it substantially. RBDs also reveal that a highly reliable redundant pair can still be undermined by a shared, single-point component such as a common suction header, a shared power supply, or a single control system. Simple RBD calculations assume independent failures. Common-cause failures, such as a shared utility loss, can defeat redundancy and should be considered separately.

    Criticality Analysis

    Criticality analysis ranks equipment by the consequences of failure: safety, environmental, production, and cost. It helps direct reliability resources to the equipment that matters most.

    A simple approach scores each asset for the severity of failure consequences and the likelihood of failure, then ranks assets by the combined score. Equipment is often grouped into categories such as:

    • Critical: Failure threatens safety, the environment, or production. These assets receive the full set of reliability practices, including FMEA, condition monitoring, and critical spares.
    • Important: Failure causes significant but manageable impact. These assets receive planned preventive and predictive tasks.
    • Standard: Failure has limited consequences. These assets may be run to failure or maintained at low cost.

    For small plants, criticality analysis is often the single most valuable first step, because it focuses limited effort where it counts.

    Reliability in Design

    Reliability starts with design. The choices made during design determine the reliability the plant can achieve.

    Design for reliability principles:

    • Simplicity: Fewer components mean fewer failure points.
    • Redundancy: Backup equipment for critical functions. Redundancy improves reliability but adds cost, complexity, and its own failure modes (such as standby equipment that fails to start), so it should be applied selectively.
    • Derating: Operating equipment below maximum ratings extends life.
    • Material selection: Materials suited to the operating environment.
    • Standardization: Common components reduce variety and simplify maintenance and spares.
    • Accessibility: Equipment accessible for inspection and maintenance.
    • Design margins: Adequate margin for uncertainty and variability.
    • Fault tolerance and fail-safe design: Systems that fail to a safe state and tolerate single faults.

    Reliability cannot be fully added after design. It must be designed in. Reliability can be improved later through modifications, but at greater cost and with less effect.

    Reliability in Operation

    Once the plant is operating, reliability depends on how it is operated and maintained.

    Operational factors:

    • Operating within design limits: Avoiding conditions outside the design envelope.
    • Proper startup and shutdown: Following procedures to minimize stress.
    • Load management: Avoiding rapid load changes that stress equipment.
    • Monitoring: Watching for signs of degradation.
    • Feedback: Reporting problems before they become failures.
    • Operator care: Routine rounds, cleanliness, lubrication checks, and early reporting of abnormal sounds, leaks, or vibration.

    Maintenance factors:

    • Preventive maintenance: Performing scheduled tasks.
    • Predictive maintenance: Monitoring condition and acting on findings.
    • Corrective maintenance: Repairing failures promptly and correctly.
    • Spare parts: Having the right parts when needed.
    • Documentation: Maintaining records that support analysis.
    • Quality of work: Correct procedures, torque values, alignment, and cleanliness, since poor workmanship is itself a common cause of failure.

    Operation and maintenance determine whether the design reliability is achieved in practice.

    Condition Monitoring and Predictive Maintenance

    Condition monitoring is a key reliability practice. It detects developing failures before they cause equipment to stop.

    Common monitoring techniques:

    Technique Detects Application
    Vibration analysis Bearing wear, imbalance, misalignment Rotating equipment
    Thermography Hot spots, loose connections, overheating Electrical panels, bearings
    Oil analysis Wear particles, contamination Gearboxes, engines, turbines
    Ultrasonic testing Leaks, thickness loss, bearing defects Piping, tanks, vessels
    Performance monitoring Efficiency loss, fouling Heat exchangers, compressors
    Motor current analysis Motor and driven equipment faults Motors, pumps, compressors
    Partial discharge testing Insulation deterioration Transformers, switchgear, medium- and high-voltage motors and cables
    Dissolved gas analysis Internal transformer faults Oil-filled transformers

    Electrical equipment. Electrical equipment, such as motors, transformers, and switchgear, also benefits from condition monitoring. Partial discharge testing, infrared thermography, and motor current analysis detect developing faults before they cause failure.

    The P-F interval. Condition monitoring works because most failures do not happen instantly. The point at which a developing problem becomes detectable (P) comes before functional failure (F). The time between the two is the P-F interval. Monitoring must be performed more often than the P-F interval, with enough warning time left to plan the repair. A vibration check every six months is of little use for a bearing whose P-F interval is a few weeks.

    Condition monitoring allows maintenance to be performed when needed, not on a fixed schedule.

    Reliability Data and Analysis

    Reliability engineering depends on data.

    Data sources:

    • Failure records: What failed, when, and why.
    • Maintenance records: What was done, when, and by whom.
    • Operating data: How equipment was operated.
    • Condition monitoring data: Trends and anomalies.
    • Design data: Specifications and expected performance.

    Analysis methods:

    • Failure rate analysis: How often does equipment fail?
    • Trend analysis: Is reliability improving or degrading?
    • Pareto analysis: Which failures cause the most problems? Often a small number of equipment items or failure modes account for most of the lost production.
    • Weibull analysis: What is the failure pattern? The Weibull shape parameter (β) indicates the pattern: β below 1 suggests early-life failures, β near 1 suggests random failures, and β above 1 suggests wear-out.
    • Root cause analysis: Why did the failure occur?

    Good data starts with consistent failure coding in the maintenance system. If work orders record only “repaired pump,” there is nothing to analyze. Recording the equipment, failure mode, cause, and downtime makes later analysis possible.

    Data without analysis is just records. Analysis turns data into insight.

    Reliability Metrics

    Key reliability metrics for industrial plants

    Reliability is measured with several key metrics.

    Metric Definition Target
    MTBF Mean time between failures Increasing over time
    MTTR Mean time to repair Decreasing over time
    Availability Percentage of time available 95%+ for most plants (varies by plant type)
    Reliability Probability of performing without failure Application-specific
    Failure rate Failures per unit time Decreasing over time
    OEE Overall equipment effectiveness (availability × performance × quality) 85%+ for world-class

    Metrics should be tracked over time to identify trends and improvement opportunities. They should also be applied to defined equipment groups, since a plant-wide average can hide a few chronic bad actors.

    Reliability Improvement

    Reliability is not static. It must be continuously improved.

    Improvement approaches:

    • Root cause analysis: Investigate failures and prevent recurrence.
    • FMEA: Identify failure modes and address them.
    • RCM: Optimize maintenance based on failure modes.
    • Reliability-centered design: Apply reliability principles to modifications.
    • Benchmarking: Compare against similar plants.
    • Best practices: Apply proven practices from industry.
    • Training: Build reliability skills in the team.
    • Culture: Make reliability a core value.

    Reliability-Centered Design for Modifications

    When equipment is modified or replaced, reliability principles should be applied to the new design. A modification that solves one problem but introduces another is not an improvement.

    In practice, this means:

    • Reviewing the failure history that prompted the change, so the modification targets the root cause rather than a symptom.
    • Applying a management of change (MOC) process so that effects on other equipment, operating procedures, and safety systems are assessed.
    • Considering maintainability, spares, and standardization for the new equipment, not just performance.
    • Updating drawings, procedures, and maintenance plans, and verifying the result after the change.

    Reliability improvement is a journey, not a destination.

    Building a Reliability Culture

    Reliability is not just a technical discipline. It is a culture.

    Elements of a reliability culture:

    • Leadership commitment: Reliability is a priority, not just a slogan.
    • Data-driven decisions: Decisions based on evidence, not opinion.
    • Proactive mindset: Fixing problems before they cause failures.
    • Continuous learning: Capturing and applying lessons.
    • Accountability: Everyone owns reliability in their area.
    • Collaboration: Operations, maintenance, and engineering work together.
    • Patience: Reliability improvements take time.

    A reliability culture is what sustains reliability over the long term.

    Reliability in Small Plants

    Small plants face particular challenges with reliability.

    Challenges:

    • Fewer resources for reliability programs.
    • Limited data for analysis.
    • Less specialist expertise.
    • Competing priorities.

    Practical approaches:

    • Focus on critical equipment: Use criticality analysis to apply reliability practices where they matter most.
    • Use simple tools: MTBF, MTTR, and failure tracking provide value without complexity.
    • Start with RCA: Investigate significant failures and prevent recurrence.
    • Use condition monitoring selectively: Apply it to critical rotating and electrical equipment.
    • Build skills gradually: Train the team on reliability basics.
    • Learn from others: Apply lessons from similar plants and from equipment suppliers.
    • Make it a habit: Reliability practices become routine over time.

    A practical starting sequence is: (1) rank equipment by criticality, (2) set up consistent failure recording, (3) track MTBF, MTTR, and downtime for critical equipment, (4) perform RCA on significant failures, (5) add condition monitoring where it is most valuable, and (6) review results regularly and expand gradually.

    Small plants can achieve high reliability with focused effort and simple tools.

    Common Mistakes in Reliability Engineering

    Even experienced organizations make mistakes. Common ones include:

    • Focusing on maintenance only: Reliability starts with design.
    • Reacting instead of preventing: Firefighting culture instead of proactive reliability.
    • Ignoring data: Making decisions without evidence.
    • Skipping RCA: Fixing symptoms instead of causes.
    • No metrics: Not measuring reliability or tracking improvement.
    • Over-maintaining: Performing unnecessary tasks, which wastes resources and can introduce errors.
    • Under-maintaining: Skipping needed tasks.
    • Treating all equipment equally: Failing to prioritize by criticality.
    • Misreading MTBF: Treating it as guaranteed life rather than a statistical average.
    • No culture: Reliability treated as a project, not a value.

    These mistakes keep plants in a cycle of failures and repairs.

    How Japanese EPC Firms Approach Reliability

    Japanese engineering firms are known for their disciplined approach to reliability. Common characteristics include:

    • Design for reliability: Reliability is designed in from the start.
    • Thorough documentation: Records support analysis and improvement.
    • Disciplined maintenance: Procedures are followed consistently.
    • Continuous improvement: Lessons are captured and applied.
    • Long-term focus: Reliability is a long-term commitment, not a short-term goal.
    • Culture: Reliability is embedded in how people work.

    For plant owners, this often means plants that perform reliably for decades.

    How to Evaluate Reliability Readiness

    When reviewing reliability for your plant, ask:

    Question Why It Matters
    Is reliability a design priority? Reliability starts with design
    Has criticality analysis been performed? Focuses effort on the equipment that matters most
    Are reliability metrics tracked? What gets measured gets improved
    Is condition monitoring in place for rotating and electrical equipment? Detects problems before failures
    Is RCA performed for significant failures? Prevents recurrence
    Is FMEA applied to critical equipment? Identifies failure modes proactively
    Is RCM used to optimize maintenance? Directs effort where it matters
    Are single points of failure identified? RBDs reveal where redundancy is needed
    Are modifications reviewed for reliability impact? Prevents new problems from being introduced
    Is there a reliability culture? Sustains reliability over time
    Is there continuous improvement? Keeps reliability from degrading

    A plant that addresses these questions is likely to achieve high reliability.

    Conclusion

    Reliability engineering is the discipline of understanding why equipment fails and applying that knowledge to prevent failures. It combines design, maintenance, operations, and data analysis into a single approach.

    For small to medium-scale industrial plants, reliability engineering is especially valuable because there is less redundancy and fewer resources to absorb failures. By focusing on design, criticality, condition monitoring, RCA, and continuous improvement, plants can achieve the reliability that keeps them productive and safe.

    Key Takeaways

    • Reliability is engineered, not accidental.
    • Reliability is the probability of performing without failure; availability also depends on maintainability.
    • The bathtub curve describes one common pattern of failure over equipment life, but not all equipment follows it.
    • Reliability engineering includes prediction, RBDs, criticality analysis, FMEA, RCM, RCA, and condition monitoring.
    • Design determines the reliability a plant can achieve, and modifications must be reviewed so they do not introduce new problems.
    • Condition monitoring applies to electrical equipment as well as rotating equipment.
    • Metrics like MTBF, MTTR, and availability track reliability performance, and MTBF is an average, not a guaranteed life.
    • A reliability culture sustains reliability over the long term.
    • Japanese EPC firms emphasize design for reliability and continuous improvement.
  • Failure Modes and Effects Analysis (FMEA): A Practical Guide for Industrial Plants

    Failure Modes and Effects Analysis (FMEA): A Practical Guide for Industrial Plants

    Most plant failures are discovered the hard way, after they happen. Equipment stops working, production is lost, and the maintenance team rushes to repair it. Root Cause Analysis (RCA) helps you learn from these failures. But what if you could identify problems before they occur?

    Failure Modes and Effects Analysis (FMEA) is a structured, proactive method for identifying how equipment, systems, or processes can fail, and what the consequences would be. Instead of reacting to failures, FMEA helps you anticipate them and prevent them or mitigate their effects.

    For small to medium-scale industrial plants, FMEA is especially valuable because it focuses attention on the failures that matter most. It directs limited maintenance and engineering resources toward the equipment and failure modes with the highest risk.

    This article explains what FMEA is, how it works, and how to apply it practically in an industrial plant.

    What Is FMEA?

    FMEA is a systematic method for evaluating a system, design, or process to identify:

    • Functions: What the item is supposed to do.
    • Failure modes: The ways in which it can fail to do so.
    • Failure effects: What happens when each failure mode occurs.
    • Failure causes: What leads to each failure mode.
    • Controls: What is currently in place to prevent or detect each failure mode.

    FMEA was originally developed by the US military in the late 1940s (the procedure MIL-P-1629, issued in 1949) and has since been adopted across many industries, including automotive, aerospace, medical devices, and power generation.

    The purpose of FMEA is to:

    • Identify potential failures before they occur.
    • Assess the risk associated with each failure.
    • Prioritize actions to reduce risk.
    • Document the analysis for future reference.

    Related standards and terms

    Several standards and guidelines govern FMEA practice. Plant teams most often encounter:

    Reference Relevance
    IEC 60812 General international standard for FMEA and FMECA
    MIL-STD-1629A Original US military procedure (now withdrawn, but still widely referenced)
    SAE J1739 and AIAG & VDA FMEA Handbook Automotive practice; source of the Action Priority method
    SAE JA1011 / JA1012 Criteria and guide for Reliability-Centered Maintenance (RCM), where FMEA is a core step

    You may also see the term FMECA (Failure Modes, Effects, and Criticality Analysis). It is FMEA with an added step that ranks the criticality of each failure mode. In practice, most plant FMEAs already include this ranking through severity and RPN, so the two terms are often used interchangeably.

    FMEA vs. RCA

    FMEA and RCA are complementary, but they serve different purposes.

    Aspect FMEA RCA
    Timing Before failure occurs (proactive) After failure occurs (reactive)
    Purpose Identify and prevent potential failures Understand and prevent recurrence of actual failures
    Approach Analyzes what could go wrong Analyzes what did go wrong
    Output Risk-ranked list of failure modes with actions Root cause(s) and corrective actions

    FMEA is proactive; RCA is reactive. Together they form a complete approach to reliability: FMEA prevents failures from happening, and RCA prevents them from happening again.

    The two also feed each other. Failures investigated through RCA reveal failure modes and causes that the FMEA missed, and the FMEA should be updated accordingly. Conversely, an existing FMEA gives an RCA team a head start by listing known failure modes and causes.

    Types of FMEA

    FMEA is used in different forms, depending on the application.

    Type Focus Typical Use
    Design FMEA (DFMEA) Product or equipment design New equipment design, modifications
    Process FMEA (PFMEA) Manufacturing or operational processes Production processes, maintenance procedures
    System FMEA Systems and subsystems Plant systems, control systems
    Equipment FMEA Individual equipment items Critical equipment, rotating machinery

    For plant applications, system FMEA and equipment FMEA are most common. Design FMEA is used when specifying new equipment or modifying existing designs.

    FMEA for new equipment

    FMEA is particularly valuable during design or procurement of new equipment. Identifying failure modes before the equipment is built or purchased allows design changes that are far cheaper than modifications after installation. Typical outcomes include adding redundancy, specifying better materials or seals, requiring condition-monitoring instrumentation from the vendor, or including FMEA deliverables in the supplier’s scope.

    The FMEA Process

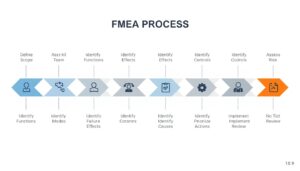
    Ten-step FMEA process diagram for industrial plants

    FMEA follows a structured process, typically performed by a cross-functional team.

    Step Description
    1. Define the scope What system, equipment, or process is being analyzed?
    2. Assemble the team Who has knowledge of the system, its operation, and its failure modes?
    3. Identify functions What is the system or equipment supposed to do?
    4. Identify failure modes How can it fail to perform its function?
    5. Identify effects What happens when each failure mode occurs?
    6. Identify causes What leads to each failure mode?
    7. Identify controls What is currently in place to prevent or detect the failure?
    8. Assess risk How serious is the risk, considering severity, occurrence, and detection?
    9. Prioritize actions Which failure modes need action first?
    10. Implement and review Assign actions, implement them, and review effectiveness.

    FMEA is not a one-time exercise. It should be reviewed when equipment, processes, or operating conditions change.

    Assembling the team

    A good FMEA team typically includes:

    • A facilitator who knows the method and keeps the session focused.
    • Operations personnel, who know how the equipment behaves in practice.
    • Maintenance personnel, who know how it fails and how it is repaired.
    • Engineering staff, who know the design and its limits.
    • Safety or environmental representatives, where consequences may involve people or releases.
    • Vendor or specialist input, where the equipment is unfamiliar or highly specialized.

    Teams of four to seven people generally work best. Larger groups slow down; smaller groups miss perspectives.

    Documenting the analysis: the FMEA worksheet

    FMEA is typically documented on a worksheet with columns for function, failure mode, effects, severity, causes, occurrence, current controls, detection, RPN, recommended actions, and responsibility. Spreadsheets are commonly used, though specialized software is available for larger analyses.

    Whatever the tool, the worksheet should use consistent scales and terminology, and it should be a living document that is stored where the maintenance and engineering teams can find it.

    Identifying Failure Modes

    A failure mode is the way in which a system, equipment, or process fails to perform its intended function.

    Types of failure modes:

    • Complete failure: Equipment stops working entirely.
    • Partial failure: Equipment works, but not at full capacity.
    • Intermittent failure: Equipment alternates unpredictably between working and not working.
    • Degraded performance: Equipment works, but with reduced efficiency, accuracy, or output.
    • Unintended operation: Equipment operates when it should not.
    • Failure to operate on demand: Equipment fails to start or act when needed, as with standby pumps and safety devices.
    • Failure to stop: Equipment continues to run after it should have stopped.

    For each function, the team asks: how could this function fail? The answers are the failure modes.

    It is important to distinguish a failure mode from its cause. “Bearing seizure” describes how the pump stops working (failure mode). “Loss of lubrication” is why the bearing seized (cause). Mixing the two makes the worksheet confusing.

    Identifying Failure Effects

    For each failure mode, the team identifies the effects: what happens when the failure occurs.

    Effects should be considered at multiple levels:

    • Local effects: What happens to the equipment itself?
    • System effects: What happens to the system the equipment is part of?
    • Plant effects: What happens to the plant as a whole?
    • Safety effects: Could the failure cause injury?
    • Environmental effects: Could the failure cause an environmental release?

    Effects should be described specifically. “Pump fails” is not an effect. “Pump fails, causing loss of cooling water flow to the condenser, resulting in turbine trip and 8-hour plant shutdown” is an effect.

    Identifying Failure Causes

    For each failure mode, the team identifies the causes: what leads to the failure.

    Common causes:

    • Design weaknesses: Inadequate material, undersized components, poor layout.
    • Manufacturing defects: Poor workmanship, incorrect assembly.
    • Installation errors: Incorrect alignment, improper torque.
    • Operating errors: Incorrect setpoints, missed procedures.
    • Maintenance errors: Missed tasks, incorrect parts, poor workmanship.
    • Wear and degradation: Normal aging, corrosion, fatigue.
    • External events: Power loss, weather, contamination.

    Causes should be specific enough to allow corrective action. “Operator error” is not a cause. “Operator fails to open valve V-101 before starting pump P-101” is a cause.

    Risk Assessment: Severity, Occurrence, Detection

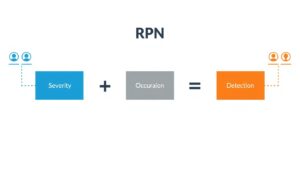
    Risk priority number calculation in FMEA

    FMEA uses three factors to assess risk:

    Factor What It Measures Scale
    Severity (S) How serious are the effects? 1 (minor) to 10 (catastrophic)
    Occurrence (O) How likely is the cause to occur? 1 (unlikely) to 10 (frequent)
    Detection (D) How likely is the failure to be detected before effects occur? 1 (certain detection) to 10 (no detection)

    The Risk Priority Number (RPN) is calculated as:

    RPN = Severity × Occurrence × Detection

    Higher RPN values indicate higher risk and greater priority for action. RPN ranges from 1 to 1,000.

    Defining the scales

    The scales must be defined in advance and applied consistently. Below is an illustrative severity scale for an industrial plant; each plant should adapt it to its own consequences.

    Rating Severity Description (example)
    1-2 No noticeable effect on operation
    3-4 Minor performance loss; repaired during routine maintenance
    5-6 Partial loss of output or short unplanned shutdown
    7-8 Extended shutdown, major equipment damage, or environmental incident
    9-10 Serious injury, fatality, or major environmental or safety event

    Occurrence and detection scales should be defined similarly, for example by expected frequency (once in 10 years vs. monthly) and by the strength of existing controls (continuous online monitoring vs. reliance on an operator noticing).

    A worked example

    Consider a cooling water pump serving a plant condenser:

    Failure Mode Effect Cause S O D RPN
    Bearing seizure Loss of cooling flow; turbine trip; 8-hour shutdown Loss of lubrication 8 5 6 240
    Suction strainer blockage Reduced flow; reduced output Debris ingress 7 4 4 112
    Mechanical seal leak Water leakage; minor repair Seal wear 5 6 3 90

    The bearing seizure ranks highest. The team recommends installing vibration and bearing-temperature monitoring, which improves detection from 6 to 3. The revised RPN is 8 × 5 × 3 = 120. Note that this reduces risk by improving detection, but severity and occurrence are unchanged. If the team can also improve lubrication practices, occurrence falls too, and the risk reduction is more durable.

    Limits of RPN

    RPN is a prioritization tool, not an absolute measure of risk. It has well-known limitations:

    • Different combinations of scores can produce the same RPN. For example, 9 × 2 × 2 = 36 and 3 × 3 × 4 = 36, yet the first involves a far more severe consequence.
    • The rating scales are ordinal, so multiplying them is mathematically questionable.
    • The result is sensitive to small changes in individual scores.

    A failure mode with high severity but low RPN should still be addressed if the consequences are serious. For instance, a relief valve that fails to lift might score 10 × 2 × 3 = 60, which looks modest, yet the consequence is unacceptable.

    Action Priority (AP) as an alternative

    Some industries have adopted Action Priority (AP) as an alternative to RPN. AP uses the same three factors but ranks actions by severity first, then occurrence and detection, avoiding some of the limitations of multiplying scores. In the AIAG & VDA method, for example, a lookup table assigns each combination of ratings a High, Medium, or Low priority, rather than a single number. Plants may use either approach, provided the choice is consistent and severity is never overlooked.

    Prioritizing Actions

    Once risks are ranked, the team prioritizes actions.

    Priority should consider:

    • Severity: Failures with high severity (safety, environmental, major production loss) should be addressed first, regardless of RPN.
    • RPN or AP: Failures with high RPN (or High AP) should be addressed before those with low ratings.
    • Cost-effectiveness: Actions should be proportionate to the risk being reduced.
    • Feasibility: Actions should be practical to implement.

    Types of actions:

    • Eliminate the failure mode: Redesign to remove the possibility of failure.
    • Reduce severity: Add protective systems, reduce consequences.
    • Reduce occurrence: Improve design, materials, or procedures.
    • Improve detection: Add monitoring, alarms, or inspections.

    Actions that eliminate or reduce risk at the source are generally preferred over those that rely on detection. Each action should have a named owner and a due date, and the failure mode should be re-scored once the action is complete to confirm the risk has actually fallen.

    Linking FMEA to maintenance

    FMEA findings should be linked to the maintenance program. Failure modes that require detection or prevention should have corresponding tasks in the preventive or predictive maintenance plan. For example, if the FMEA identifies bearing seizure as a high-priority mode, the maintenance plan should include lubrication checks, oil analysis, and vibration monitoring at defined intervals. Without this link, the FMEA remains a document rather than a driver of reliability.

    FMEA in Practice

    FMEA can be applied at different levels, depending on the scope and resources available.

    Approach Scope When to Use
    Full FMEA Detailed analysis of all failure modes Critical systems, new designs
    Streamlined FMEA Focused analysis using templates and experience Most plant equipment
    Criticality-based FMEA Analysis of critical equipment only Small plants with limited resources
    Process FMEA Analysis of operational or maintenance processes Procedures, work instructions

    For small to medium-scale plants, a criticality-based or streamlined approach is often the most practical. Full FMEA on every piece of equipment is rarely justified.

    Where to start

    A practical starting sequence for a plant new to FMEA:

    1. Rank equipment by criticality, considering safety, environmental impact, production loss, and repair cost.
    2. Select the top few items, such as major rotating machinery, key utilities, and critical control loops.
    3. Use generic failure mode lists from equipment vendors, industry databases, and your own maintenance history as a starting point, and then adapt them to your operating conditions.
    4. Run short, focused workshops, typically half a day per equipment item.
    5. Expand gradually as the team gains experience.

    When to trigger a review

    Beyond scheduled reviews, revisit the FMEA when:

    • A significant failure or near miss occurs (especially if the RCA reveals a failure mode not in the FMEA).
    • Equipment is modified, replaced, or moved to a different duty.
    • Operating conditions or fuel/feed quality change.
    • Maintenance strategies or spare parts policies change.

    FMEA and RCM

    FMEA is closely related to Reliability-Centered Maintenance (RCM). In fact, FMEA is a key tool within the RCM process.

    Aspect FMEA RCM
    Focus Identifying failure modes and their effects Determining maintenance requirements
    Scope Any system, design, or process Physical assets in their operating context
    Output Risk-ranked list of failure modes Maintenance program based on failure modes and consequences
    Relationship FMEA is a tool used within RCM RCM uses FMEA as part of its analysis

    If you have already performed RCM, much of the FMEA analysis is already done. If you have not, FMEA can be a good starting point for improving reliability.

    FMEA and Other Risk Tools

    FMEA is one of several risk-analysis tools, each suited to different questions:

    Tool Best For
    FMEA Equipment- and component-level failure modes and their effects
    HAZOP Process hazards and deviations in process systems
    Fault Tree Analysis (FTA) Tracing a specific top-level event back to its combinations of causes
    Bow-tie / LOPA Evaluating barriers and protection layers for major hazards

    FMEA works from causes toward effects (bottom-up), while fault tree analysis works from a defined event back toward causes (top-down). On critical systems the two are often used together.

    Common Mistakes in FMEA

    Even experienced teams make mistakes. Common ones include:

    • Analyzing too much: Trying to FMEA everything, which exhausts the team and dilutes the value.
    • Analyzing too little: Focusing only on obvious failure modes and missing important ones.
    • Vague failure modes: “Equipment fails” is not useful; “Pump seal leaks” is.
    • Ignoring severity: Prioritizing by RPN alone without considering safety or environmental consequences.
    • Inconsistent scoring: Using different scales or interpretations from one session to the next.
    • No team involvement: Missing knowledge from operations, maintenance, or engineering.
    • Scoring the same failure twice: Rating a control as effective without checking that it is actually performed.
    • No follow-through: Producing a report without implementing actions.
    • Treating FMEA as a one-time project: Failing to update the analysis as conditions change.

    These mistakes reduce the value of FMEA and can lead to its abandonment.

    How Japanese EPC Firms Approach FMEA

    Japanese engineering firms are known for their disciplined approach to reliability and risk analysis. Common characteristics include:

    • Thorough analysis: FMEA is performed carefully, with input from all relevant disciplines.
    • Focus on critical equipment: Resources are directed to equipment where failure matters most.
    • Detailed documentation: Analysis, decisions, and results are carefully recorded.
    • Integration with design: FMEA findings are fed back into design standards and future projects.
    • Continuous improvement: FMEA is reviewed and updated as conditions change.
    • Long-term focus: FMEA is treated as an ongoing practice, not a one-time project.

    For plant owners, this often means fewer unexpected failures, better-targeted maintenance, and a stronger safety record.

    How to Evaluate FMEA Readiness

    When considering FMEA for your plant, ask:

    Question Why It Matters
    Is the scope clearly defined? Focuses the analysis on what matters
    Is there a cross-functional team? Brings together operations, maintenance, and engineering
    Are failure modes specific? Enables meaningful analysis and action
    Are effects assessed at multiple levels? Captures safety, environmental, and production impacts
    Are the rating scales defined and applied consistently? Ensures prioritization is fair and repeatable
    Are actions specific and assigned? Ensures actions are implemented
    Are findings linked to the maintenance program? Turns analysis into practical reliability tasks
    Is the analysis documented and reviewed? Keeps the analysis current and useful

    A plant that addresses these questions is ready to benefit from FMEA.

    Conclusion

    Failure Modes and Effects Analysis is a proactive method for identifying how equipment, systems, or processes can fail, and what the consequences would be. It helps plants anticipate failures rather than react to them.

    For small to medium-scale industrial plants, FMEA, applied pragmatically, can improve reliability, reduce risk, and focus limited resources where they matter most. It is not a quick fix, but it is a proven approach for plants that want to get ahead of failures instead of chasing them.

    Key Takeaways

    • FMEA is a proactive method for identifying failure modes and their effects.
    • FMEA is distinct from RCA: one prevents failures, the other prevents recurrence.
    • The process includes scope definition, team assembly, function identification, failure mode identification, risk assessment, and action.
    • Risk is assessed using severity, occurrence, and detection (RPN), with Action Priority (AP) as an alternative that weights severity first.
    • Actions that eliminate or reduce risk at the source are preferred over those that rely on detection.
    • FMEA findings should be linked to the maintenance program and applied early, during design and procurement of new equipment.
    • FMEA is a key tool within RCM.
    • Japanese EPC firms emphasize thorough analysis and integration with design.
  • Root Cause Analysis (RCA): A Practical Guide for Industrial Plants

    Root Cause Analysis (RCA): A Practical Guide for Industrial Plants

    When equipment fails, the immediate response is usually to fix it and get the plant running again. That is necessary. But if the same failure keeps happening, or if the fix addresses only the symptom and not the underlying problem, the plant is caught in a cycle of repeated failures and repeated repairs.

    Root Cause Analysis (RCA) is a structured approach for finding out why a failure happened, not just what failed, and preventing it from happening again. It is one of the most valuable skills a plant team can develop, because it turns every significant failure into an opportunity to improve.

    For small to medium-scale industrial plants, RCA is especially important because there is less redundancy and fewer resources to absorb repeat failures. A pump that fails every few months is more than an inconvenience; it is a drain on maintenance resources and a threat to production.

    This article explains what RCA is, how it works, and how to apply it practically in an industrial plant.

    What Is Root Cause Analysis?

    Root Cause Analysis is a structured method for identifying the underlying causes of a problem and determining what can be done to prevent recurrence.

    The key idea is that most failures have more than one cause. There is usually a chain of events and conditions that led to the failure. RCA traces that chain back to the root: the fundamental cause or causes that, if addressed, would prevent the failure from happening again.

    RCA is not about assigning blame. It is about understanding what happened, why it happened, and what can be done to prevent it from happening again.

    RCA vs. Troubleshooting

    RCA is distinct from troubleshooting. Troubleshooting focuses on restoring operation as quickly as possible. RCA focuses on understanding why the failure occurred and preventing recurrence. Both are necessary, but they serve different purposes.

    Troubleshooting Root Cause Analysis
    Goal Restore operation Prevent recurrence
    Timing During the event After the plant is stable
    Time scale Minutes to hours Days to weeks
    Output A repair or workaround Corrective actions and lessons learned
    Question asked “What is wrong and how do we fix it?” “Why did this happen and how do we stop it happening again?”

    The two work together. Troubleshooting should also preserve evidence for the RCA that follows (see “Gathering Data” below).

    Three Types of Causes

    RCA distinguishes between three layers of cause:

    • Physical causes: The observable failure mechanism (a bearing seized, a seal leaked, a wire overheated).
    • Human causes: The actions or omissions that allowed the physical cause to occur (lubrication was skipped, a strainer was not cleaned).
    • Latent (system) causes: The weaknesses in procedures, design, training, planning, or management that made the human cause likely (no scheduled task, unclear procedure, no alarm).

    Effective RCA does not stop at the physical or human cause. It reaches the latent cause, because that is what can be fixed permanently.

    Why RCA Matters

    Without RCA, plants tend to repeat the same failures. Common patterns include:

    • Fixing symptoms, not causes: Replacing a failed bearing without addressing the misalignment that caused it to fail.
    • Blaming operators: Assuming human error without examining why the error was possible.
    • Skipping analysis: Restarting the plant as quickly as possible and moving on.
    • Applying the wrong fix: Making changes that do not address the real cause.

    RCA breaks these patterns by:

    • Identifying true causes: Not just the immediate cause, but the underlying causes.
    • Preventing recurrence: Addressing causes rather than symptoms.
    • Improving systems: Finding weaknesses in procedures, training, design, or management.
    • Capturing knowledge: Recording what was learned for future reference.

    For small plants, RCA helps avoid the cycle of repeated failures that consumes maintenance resources and disrupts production. Over time, it also reduces unplanned downtime, spare parts consumption, and emergency repair costs.

    When to Perform RCA

    Not every failure requires full RCA. Performing RCA on every minor issue wastes resources. Performing it on none means repeating failures.

    Triggers for RCA:

    Trigger Why It Matters
    Safety incident or near-miss Protects people and prevents recurrence
    Environmental release Ensures compliance and prevents recurrence
    Significant production loss Protects revenue and customer commitments
    Repeat failure Indicates the true cause has not been addressed
    High repair cost Justifies analysis to prevent recurrence
    Equipment criticality Failure of critical equipment affects the whole plant

    For small plants, a threshold approach works well: perform RCA on failures that meet defined criteria (for example, downtime over a certain number of hours, cost over a certain amount, or any safety incident).

    Why Near-Misses Matter

    Near-misses are valuable RCA triggers because they reveal weaknesses that could cause a more serious incident. Investigating near-misses is a proactive way to prevent future incidents.

    A near-miss costs nothing but attention, since no one was hurt and nothing was damaged. Yet the causal chain is often the same as in a serious accident; only the outcome differed. Plants that investigate near-misses learn from luck, rather than waiting to learn from loss.

    Matching Effort to the Problem

    A simple, tiered approach keeps RCA proportionate:

    Level Typical Trigger Approach
    Basic Minor repeat failure, low cost 5 Whys by the supervisor and one or two technicians; short record
    Standard Significant downtime or cost Cross-functional team; fishbone plus 5 Whys; formal report
    Major Serious safety, environmental, or high-consequence failure Facilitated team; fault tree or barrier analysis; management review

    The RCA Process

    Seven-step root cause analysis process diagram

    While different RCA methods exist, most follow a similar process.

    Step Description
    1. Define the problem What happened, when, where, and what was the impact?
    2. Gather data Collect evidence: operating data, maintenance records, interviews, physical evidence.
    3. Identify causes Use analytical methods to trace the chain of causes.
    4. Determine root cause(s) Identify the fundamental cause(s) that, if addressed, prevent recurrence.
    5. Develop corrective actions Define actions that address the root cause(s).
    6. Implement actions Assign responsibility, resources, and deadlines.
    7. Verify effectiveness Confirm that the actions prevented recurrence.

    RCA is not complete until the corrective actions are implemented and verified.

    Defining the Problem

    A well-written problem statement keeps the team focused. It should be factual and specific, and should not include assumed causes or blame. Compare:

    • Weak: “Operator error damaged Pump P-101.”
    • Strong: “Pump P-101 mechanical seal leaked on 14 March at 02:30, causing a 9-hour shutdown of Line 2 and an estimated production loss of X.”

    Include what happened, where, when, the extent of the impact, and how it was detected.

    The RCA Team

    For anything beyond a basic analysis, use a small cross-functional team, typically three to six people. Useful members include:

    • An operator who was on shift or familiar with the equipment
    • A maintenance technician or planner
    • An engineer (process, mechanical, or instrumentation as relevant)
    • A facilitator who keeps the process on track and ensures no one is blamed

    The facilitator should ideally not be the person responsible for the area under review. In a small plant, this may be a supervisor from another department.

    RCA Methods and Tools

    Several methods and tools are available. The choice depends on the complexity of the problem and the experience of the team.

    Method Description Best For
    5 Whys Asking “why” repeatedly until the root cause is found Simple problems
    Fishbone (Ishikawa) diagram Categorizing causes by type (people, method, machine, material, measurement, environment) Problems with multiple possible causes
    Fault tree analysis Working backward from the failure to identify contributing events and their logical relationships Complex systems with multiple failure paths
    Cause-and-effect matrix Scoring causes against defined criteria to prioritize which to investigate or address Prioritizing among many causes
    Barrier analysis Examining which barriers failed and why Safety and environmental incidents

    For most plant problems, 5 Whys and fishbone diagrams are sufficient. Fault tree analysis is used for complex or high-consequence failures.

    The 5 Whys

    The 5 Whys is the simplest RCA method. It involves asking “why” repeatedly until a root cause is found that can be fixed. Five is a guideline: some problems need three whys, others need seven.

    Example: Pump seal failure

    1. Why did the pump leak? → The seal failed.
    2. Why did the seal fail? → The seal faces were damaged.
    3. Why were the seal faces damaged? → The pump was running dry.
    4. Why was the pump running dry? → The suction strainer was blocked.
    5. Why was the suction strainer blocked? → It had not been cleaned on schedule.
    6. Why was it not cleaned on schedule? → The cleaning task was not in the preventive maintenance plan, and there was no differential pressure indication to show the strainer was fouling.

    Root causes: No scheduled strainer cleaning task, and no instrumentation to warn of a blocked strainer.

    Note that the root cause is not “the seal failed” (the immediate cause), and it is not “the operator forgot” either. Both stop short of the system weakness that allowed the failure to happen.

    Corrective actions might include: adding the cleaning task to the maintenance plan, reviewing and improving the procedure, installing a differential pressure alarm on the strainer, adding a low-flow trip on the pump, and training operators on the reason for the task.

    Limitations of 5 Whys: It follows a single chain, so it can miss parallel causes. It depends on the knowledge of the people asking, and it can be led toward a preferred answer. For anything significant, support it with data and combine it with a fishbone diagram.

    Fishbone Diagrams

    Fishbone diagram for root cause analysis in industrial plants

    A fishbone diagram (also called an Ishikawa diagram) organizes possible causes into categories. The classic categories are:

    • People: Training, staffing, communication
    • Method: Procedures, work instructions, practices
    • Machine: Equipment design, condition, maintenance
    • Material: Raw materials, spare parts, consumables
    • Measurement: Instrumentation, calibration, data
    • Environment: Operating conditions, weather, contamination

    The team brainstorms possible causes in each category, then narrows down to the most likely ones through data and discussion. A fishbone lists possible causes; it does not prove any of them. Each candidate cause should be confirmed or ruled out with evidence before it is treated as a root cause.

    Fault Tree and Barrier Analysis

    For complex or serious events, two further methods are useful:

    • Fault tree analysis starts with the failure at the top and works downward, showing which combinations of events (using AND/OR logic) could have produced it. It is valuable when several independent failures had to occur together.
    • Barrier analysis asks what safeguards were supposed to prevent the event (alarms, trips, relief valves, procedures, guards), and why each one failed or was absent.

    Gathering Data

    Good RCA depends on good data. Sources include:

    • Operating data: Trends, alarms, setpoints
    • Maintenance records: Work orders, inspection reports, parts replaced
    • Interviews: Operators, maintenance staff, supervisors
    • Physical evidence: Failed parts, photographs, samples
    • Procedures and drawings: What was supposed to happen vs. what did

    Collecting data early is important. Physical evidence can be lost, and memories fade.

    Preserving evidence: Before repairing, photograph the failed component in place, tag and retain failed parts, and record settings, positions, and readings. Save control system trends and alarm logs before they are overwritten. Where practical, do not clean failed parts before they are inspected.

    Interviewing well: Interview people separately and soon after the event. Ask open questions (“what did you see?”) rather than leading ones (“didn’t you skip the check?”). Make it clear the purpose is to understand the system, not to assign blame. People share more when they trust that the process is fair.

    Building a timeline: A simple sequence of events, with times, from normal operation through the failure and response, often reveals gaps and contradictions that are not obvious otherwise.

    Determining Root Cause

    Determining the root cause requires distinguishing between different levels of causation.

    Level Description Example
    Immediate cause What directly caused the failure Bearing seized
    Contributing cause What made the failure more likely Lubrication was overdue
    Root cause The fundamental cause that, if addressed, prevents recurrence No lubrication task was scheduled or assigned in the maintenance system

    In many cases, there are multiple root causes. For example, a failure might result from both a design weakness and a maintenance gap. Both must be addressed.

    A common mistake is to stop at the immediate cause or the first plausible explanation. Good RCA keeps asking “why” until it reaches a cause that can actually be fixed.

    A useful test: A cause is likely a true root cause if (1) removing it would have prevented the failure, (2) it is within the plant’s ability to control, and (3) addressing it would also prevent similar failures elsewhere.

    Handling Human Error

    When human error is a factor, RCA should examine why the error was possible: was the procedure unclear, the training inadequate, or the task design flawed? Human error is usually a symptom of a system weakness, not a root cause in itself.

    Useful questions include:

    • Was the procedure available, clear, and current?
    • Was the person trained and competent for the task?
    • Was the workload, time pressure, or shift arrangement a factor?
    • Was the equipment or display designed in a way that invites mistakes?
    • Would another competent person have made the same error in the same situation?

    If the last answer is “yes,” the problem is the system, not the individual. Treating it as an individual failing will not prevent recurrence.

    Corrective Actions

    Corrective actions should address the root cause, not just the symptom.

    Types of corrective actions:

    • Engineering: Design changes, material changes, added instrumentation
    • Procedural: Revised procedures, added steps, clearer instructions
    • Training: Additional training, refresher courses, competency assessment
    • Organizational: Staffing changes, clearer responsibilities, better communication
    • Monitoring: Added condition monitoring, alarms, or inspections

    Prefer stronger actions. Actions that remove or engineer out the hazard (a design change, an interlock, an alarm) are generally more reliable than actions that depend on people remembering (a reminder, a retraining session). Where a procedural or training action is used, back it up with a check or a monitoring measure.

    Corrective actions should be:

    • Specific: Clearly defined and actionable.
    • Assigned: Someone is responsible for each action.
    • Time-bound: Each action has a deadline.
    • Verified: Completion is confirmed.

    Actions that are vague (“improve training”) or unassigned tend not to happen.

    Weigh cost against benefit. Compare the cost of an action with the cost of recurrence (repair, lost production, safety exposure). Where an ideal fix is not affordable now, adopt an interim measure and record the longer-term action.

    Verification

    RCA is not complete until corrective actions are verified.

    Verification methods:

    • Follow-up inspection: Confirming that the corrective action was implemented.
    • Performance monitoring: Confirming that the failure has not recurred.
    • Audit: Reviewing records and practices to confirm compliance.
    • Trend analysis: Tracking failure rates over time.

    Verification has two parts: confirming the action was done (implementation) and confirming it worked (effectiveness). Effectiveness may take weeks or months to demonstrate, so set a review date.

    If the failure recurs, the analysis and the actions should be revisited. The root cause may have been misidentified, the actions may not have been fully implemented, or they may not have been effective enough.

    Documenting RCA and Managing Knowledge

    A brief written record turns one investigation into lasting plant knowledge. A simple RCA report should include:

    • Problem statement and impact
    • Team members and date
    • Timeline and key evidence
    • Causes identified and root cause(s)
    • Corrective actions with owner and due date
    • Verification results

    RCA findings should be stored in a searchable database so that lessons can be applied to similar equipment elsewhere in the plant. Without this, the same failure may be investigated repeatedly in different areas.

    In practice, a shared folder with consistent file names, or a field in the maintenance management system, is enough for a small plant. Tag each record with equipment type, failure mode, and area so it can be found later. Review past RCAs when planning maintenance, updating procedures, and training new staff. Also ask whether a finding applies to similar equipment elsewhere, such as other pumps on the same service.

    Common Mistakes in RCA

    Even experienced teams make mistakes. Common ones include:

    • Stopping too early: Accepting the first plausible cause without digging deeper.
    • Blaming individuals: Focusing on human error without examining the system that allowed it.
    • Skipping data collection: Relying on memory and assumption rather than evidence.
    • Not involving the right people: Missing knowledge from operators, maintenance, or engineering.
    • Vague corrective actions: Actions that are not specific, assigned, or time-bound.
    • Not verifying: Assuming the fix worked without confirming it.
    • Not documenting: Losing the knowledge for future reference.
    • Starting with a preferred answer: Using the analysis to justify a conclusion already reached.
    • Analyzing too much: Applying full RCA to every minor event, which exhausts the team and discredits the process.

    These mistakes reduce the value of RCA and allow failures to recur.

    How Japanese EPC Firms Approach RCA

    Japanese engineering firms are widely known for their disciplined approach to problem-solving. Common characteristics include:

    • Thorough investigation: Time is taken to gather data and understand the problem fully.
    • Team involvement: RCA is performed with input from operations, maintenance, and engineering.
    • System focus: The focus is on improving systems, not blaming individuals.
    • Detailed documentation: Analysis, decisions, and results are carefully recorded.
    • Verification: Corrective actions are tracked and verified.
    • Long-term learning: Lessons are captured and applied across the plant, and often fed back into design standards and future projects.

    For plant owners, this often means fewer repeat failures and a culture of continuous improvement.

    How to Evaluate RCA Readiness

    When considering RCA for your plant, ask:

    Question Why It Matters
    Are triggers for RCA defined? Ensures RCA is performed when it matters
    Is there a standard process? Ensures consistency and completeness
    Are the right people involved? Brings together operations, maintenance, and engineering
    Is data collected and evidence preserved systematically? Ensures analysis is based on evidence
    Is there a no-blame culture? Encourages honest reporting, including near-misses
    Are corrective actions specific and assigned? Ensures actions are implemented
    Is verification performed? Confirms that failures do not recur
    Is documentation searchable and shared? Captures knowledge for future reference

    A plant that addresses these questions is ready to benefit from RCA.

    Conclusion

    Root Cause Analysis is a structured approach for finding out why failures happen and preventing them from happening again. It replaces the cycle of repeated repairs with a cycle of learning and improvement.

    For small to medium-scale industrial plants, RCA is especially valuable because repeat failures consume limited resources and disrupt production. Applied consistently, RCA improves reliability, reduces maintenance cost, and builds a culture of continuous improvement.


    Key Takeaways

    • RCA identifies the underlying causes of failures and prevents recurrence
    • RCA is distinct from troubleshooting: one restores operation, the other prevents repeat failures
    • Triggers include safety incidents, near-misses, production loss, repeat failures, and critical equipment
    • The process includes problem definition, data gathering, cause identification, and verification
    • Methods include 5 Whys, fishbone diagrams, fault tree analysis, and barrier analysis
    • Corrective actions must be specific, assigned, time-bound, and verified
    • Human error is usually a symptom, not a root cause
    • RCA findings should be documented and stored in a searchable database
    • Japanese EPC firms emphasize thorough investigation and system focus
  • Reliability-Centered Maintenance (RCM): A Practical Guide for Industrial Plants

    Reliability-Centered Maintenance (RCM): A Practical Guide for Industrial Plants

    Every plant has maintenance tasks it performs because they have always been done. Filters changed on a fixed schedule. Bearings greased every month. Equipment overhauled every few years. These tasks may be necessary—or they may be wasted effort that adds cost without improving reliability.

    Reliability-Centered Maintenance (RCM) is a structured approach that asks a simple question: what maintenance does this equipment actually need to keep doing what it is supposed to do? Instead of applying generic schedules, RCM analyzes each asset’s functions, failure modes, and consequences to determine the right maintenance for the right reasons.

    For small to medium-scale industrial plants, RCM can be especially valuable because it focuses limited maintenance resources where they matter most. It helps avoid both under-maintaining critical equipment and over-maintaining non-critical equipment.

    This article explains what RCM is, how it works, and how to apply it practically in an industrial plant.

    What Is Reliability-Centered Maintenance?

    RCM is a process for determining the maintenance requirements of any physical asset in its operating context. It was originally developed in the aviation industry in the 1960s and has since been applied across many industries, including power generation, oil and gas, and manufacturing.

    The core idea is simple: maintenance should be driven by the consequences of failure, not by habit or manufacturer recommendations alone.

    The formal requirements for RCM are defined in SAE JA1011, “Evaluation Criteria for Reliability-Centered Maintenance (RCM) Processes.” This standard specifies what a process must do to be called RCM. It does not prescribe a specific methodology, but it sets minimum criteria—such as answering the seven core questions—that any process must meet before it can legitimately be labeled RCM. This matters for plant owners because vendors and consultants sometimes market simplified maintenance reviews as “RCM” when they do not meet the standard’s criteria.

    RCM asks:

    • What is the equipment supposed to do?
    • What happens if it fails?
    • What causes it to fail?
    • What can be done to prevent or detect failure?
    • What if we cannot prevent it?

    The answers determine what maintenance is performed, how often, and by whom.

    Why RCM Matters

    Traditional maintenance approaches often lead to two problems:

    1. Over-maintenance:
    Performing tasks that are not needed, or performing them too frequently. This wastes labor, materials, and downtime. It can also introduce new failure modes (e.g., damage during overhaul).

    2. Under-maintenance:
    Failing to perform tasks that are needed, or performing them too infrequently. This leads to unexpected failures, downtime, and safety incidents.

    RCM helps find the right balance by focusing on:

    • Critical equipment: Where failure has serious consequences.
    • Failure modes: What actually causes equipment to fail.
    • Consequences: What happens if failure occurs.
    • Cost-effectiveness: Whether the maintenance task is worth doing.

    For small plants with limited resources, RCM helps direct effort where it has the greatest impact.

    The Seven Questions of RCM

    Seven questions of reliability-centered maintenance diagram

    RCM is built around seven questions that must be answered for each asset.

    Question What It Addresses
    1. What are the functions and performance standards? What is the equipment supposed to do, and to what standard?
    2. What are the functional failures? How does the equipment fail to meet its function?
    3. What are the failure modes? What causes each functional failure?
    4. What are the failure effects? What happens when each failure mode occurs?
    5. What are the failure consequences? How serious are the effects?
    6. What can be done to predict or prevent the failure? What tasks can address the failure mode?
    7. What if no suitable task can be found? What is the fallback if prevention is not possible?

    Answering these questions systematically produces a maintenance program based on actual need.

    Failure Consequences

    Not all failures are equal. RCM categorizes consequences into four types:

    Consequence Category Description Examples
    Safety and environmental Failure could cause injury, loss of life, or environmental damage Pressure vessel rupture, toxic release
    Operational Failure affects output, quality, or cost Pump failure stopping production
    Non-operational Failure affects only repair cost Minor instrument failure
    Hidden Failure is not evident to operators Standby pump failure

    The category determines how much effort is justified in preventing the failure. Safety and environmental consequences justify the most effort. Non-operational consequences justify the least.

    Failure Modes and Effects Analysis (FMEA)

    FMEA is the analytical tool used in RCM to identify failure modes and their effects. It is typically performed by a team that includes:

    • Operations personnel (who know how equipment is used)
    • Maintenance personnel (who know how equipment fails)
    • Engineers (who understand design and failure mechanisms)
    • Facilitator (who guides the process)

    The facilitator guides the RCM analysis, ensures the team follows the process, and keeps the discussion focused. A skilled facilitator is essential for an effective RCM analysis, especially when the team includes members with different perspectives. Without strong facilitation, sessions can drift into unrelated troubleshooting discussions or get stuck debating failure probabilities instead of moving through the seven questions in sequence.

    Typical FMEA steps:

    1. Define the equipment and its functions.
    2. Identify functional failures.
    3. Identify failure modes for each function.
    4. Identify failure effects for each mode.
    5. Assess consequences.
    6. Identify existing controls.
    7. Recommend actions.

    FMEA is best performed as a team exercise. It captures knowledge from multiple perspectives and builds ownership of the resulting maintenance program.

    Maintenance Task Selection

    Once failure modes are identified, RCM determines what maintenance, if any, is appropriate.

    Task categories:

    Task Type Description When to Use
    Preventive (scheduled) Tasks performed at fixed intervals When failure has a clear age-related pattern
    Predictive (condition-based) Tasks based on condition monitoring When failure can be detected before it occurs
    Detection (failure-finding) Tasks that check hidden functions For hidden failures (e.g., standby equipment)
    Redesign Changing equipment or procedures When no task is effective
    Run-to-failure No maintenance until failure When consequences are acceptable

    The choice depends on the failure mode and its consequences. Not every failure mode can be prevented, and not every one needs to be.

    The RCM Decision Process

    The decision process can be summarized as follows:

    1. Is the failure mode evident to operators?
      If no, use failure-finding tasks.
    2. Does the failure mode have safety or environmental consequences?
      If yes, preventive or predictive tasks must be applied, or the design must be changed.
    3. Does the failure mode have operational consequences?
      If yes, preventive or predictive tasks are justified if cost-effective.
    4. Does the failure mode have only non-operational consequences?
      If yes, run-to-failure may be acceptable.
    5. Is there a suitable task?
      If no, consider redesign or accept the risk.

    This process ensures that maintenance effort is proportional to the consequences of failure.

    Applying RCM in Practice

    Full RCM can be time-consuming, especially for large plants with many assets. For small to medium-scale plants, a pragmatic approach is often appropriate.

    Practical steps:

    1. Select the scope: Focus on critical equipment first. Not every asset needs full RCM analysis.
    2. Assemble the team: Include operations, maintenance, and engineering.
    3. Gather information: Equipment manuals, failure history, and operating experience.
    4. Perform FMEA: Identify functions, failures, modes, effects, and consequences.
    5. Select tasks: Determine what maintenance is appropriate for each failure mode.
    6. Document decisions: Record the analysis and the resulting maintenance program.
    7. Implement and review: Apply the program and review it periodically.

    For plants new to RCM, a pilot project on one critical system is often recommended. This allows the team to learn the process, demonstrate results, and build support before applying RCM more broadly. A well-chosen pilot—typically a system with a known reliability problem or high consequence of failure—gives the team a visible win that makes it easier to justify expanding RCM to the rest of the plant.

    RCM analysis can be supported by specialized software that guides the team through the seven questions, stores failure mode data, and generates maintenance tasks. Spreadsheets can also be used for smaller analyses. Software tools become more valuable as the number of assets grows, since they make it easier to track decisions, link failure modes to maintenance tasks in a CMMS, and update the analysis over time.

    RCM is not a one-time exercise. It should be reviewed as equipment ages, operating conditions change, and new information becomes available.

    Streamlined Approaches

    Full RCM can be resource-intensive. Several streamlined approaches are available:

    Approach Description When to Use
    Classical RCM Full seven-question analysis for each asset Critical, complex equipment
    Streamlined RCM Focused analysis using templates and experience Most plant equipment
    PM Optimization Review and improve existing maintenance program When a program already exists
    Criticality-based Apply RCM only to critical equipment Small plants with limited resources

    For small plants, a criticality-based or streamlined approach is often the most practical.

    Common Mistakes in RCM

    Even experienced practitioners make mistakes. Common ones include:

    • Applying RCM to everything: Wasting resources on non-critical equipment.
    • Skipping the team approach: Missing knowledge from operations and maintenance.
    • Ignoring consequences: Focusing on failure modes without assessing their impact.
    • Over-analyzing: Getting lost in detail rather than making decisions.
    • Not implementing results: Producing a report that sits on a shelf.
    • Not reviewing: Failing to update the analysis as conditions change.
    • Confusing RCM with a one-time project: Treating it as a task, not a practice.

    These mistakes reduce the value of RCM and can lead to its abandonment.

    How Japanese EPC Firms Approach RCM

    Japanese engineering firms are known for their disciplined approach to maintenance and reliability. Common characteristics include:

    • Thorough analysis: RCM is performed carefully, with input from all relevant disciplines.
    • Focus on critical equipment: Resources are directed to equipment where failure matters most.
    • Detailed documentation: Analysis, decisions, and results are carefully recorded.
    • Integration with operations: RCM is connected to daily operations and maintenance planning.
    • Continuous improvement: RCM is reviewed and updated as conditions change.
    • Long-term focus: RCM is treated as an ongoing practice, not a one-time project.

    For plant owners, this often means a maintenance program that is both effective and efficient—neither over-maintaining nor under-maintaining.

    How to Evaluate RCM Readiness

    When considering RCM for your plant, ask:

    Question Why It Matters
    Is critical equipment identified? Focuses RCM effort where it matters
    Is there a cross-functional team? Brings together operations, maintenance, and engineering
    Is failure history available? Informs failure mode analysis
    Are consequences assessed? Determines how much effort is justified
    Are tasks selected based on failure mode? Ensures maintenance is appropriate
    Is the analysis documented? Supports implementation and review
    Is there a plan for review? Keeps the program current

    A plant that addresses these questions is ready to benefit from RCM.

    Key Takeaways

    • RCM determines maintenance requirements based on functions, failure modes, and consequences, and its requirements are formally defined in SAE JA1011.
    • The seven questions provide a structured framework for analysis.
    • Failure consequences (safety, operational, non-operational, hidden) determine how much effort is justified.
    • FMEA, guided by a skilled facilitator, identifies failure modes and their effects.
    • Maintenance tasks are selected based on failure mode and consequence.
    • A pilot project on one critical system helps plants new to RCM build the process and demonstrate value before scaling up.
    • Streamlined approaches and supporting software make RCM practical for small plants.
    • Japanese EPC firms emphasize thorough analysis and integration with operations.

    Conclusion

    Reliability-Centered Maintenance is a structured approach to determining what maintenance equipment actually needs. It replaces habit and generic schedules with analysis based on functions, failure modes, and consequences.

    For small to medium-scale industrial plants, RCM—applied pragmatically—can improve reliability, reduce maintenance cost, and focus limited resources where they matter most. It is not a quick fix, but it is a proven approach for plants that want to get maintenance right.

  • Plant Operations and Maintenance: Key Strategies for Reliability and Efficiency

    Plant Operations and Maintenance: Key Strategies for Reliability and Efficiency

    Commissioning ends, and operation begins. From this point forward, the plant must run reliably, efficiently, and safely for years—often decades. Operations and maintenance (O&M) is what determines whether the plant delivers on the promises made during design and construction.

    For small to medium-scale industrial plants, O&M is especially critical because there is less redundancy and fewer resources to absorb unexpected failures. A well-run O&M program keeps the plant available, controls costs, and extends equipment life. A poor one leads to frequent outages, rising maintenance costs, and declining performance.

    This article covers the key strategies for reliable and efficient plant operations and maintenance, from organization and planning to condition monitoring and continuous improvement.

    What Is Operations and Maintenance?

    Operations and maintenance covers everything required to run the plant and keep it in good condition.

    Operations includes:

    • Running the plant to meet production targets
    • Monitoring process parameters
    • Responding to alarms and disturbances
    • Optimizing performance
    • Managing startup, shutdown, and load changes

    Maintenance includes:

    • Preventive maintenance (scheduled tasks)
    • Predictive maintenance (condition-based)
    • Corrective maintenance (repairs after failure)
    • Overhauls and inspections
    • Spare parts management

    O&M is not just about keeping equipment running. It is about running the plant safely, efficiently, and cost-effectively over its entire life.

    Why O&M Matters

    O&M determines the plant’s long-term performance.

    Factor Impact of Good O&M Impact of Poor O&M
    Availability High (fewer unplanned outages) Low (frequent breakdowns)
    Efficiency Maintained or improved Degrades over time
    Maintenance cost Controlled and predictable Rising and unpredictable
    Equipment life Extended Shortened
    Safety High Compromised
    Compliance Maintained At risk

    For plant owners, O&M is where the return on investment is realized—or lost.

    O&M Organization

    A clear organizational structure is essential for effective O&M.

    Key roles:

    • Plant manager: Overall responsibility for plant operations and maintenance.
    • Operations manager/supervisor: Manages day-to-day operations and shift teams.
    • Maintenance manager/supervisor: Manages maintenance planning, scheduling, and execution.
    • Shift operators: Run the plant during their shifts.
    • Maintenance technicians: Perform preventive, predictive, and corrective maintenance.
    • Engineers: Provide technical support for troubleshooting and improvement.

    Staffing considerations:

    • Shift coverage: How many operators are needed per shift, and how many shifts?
    • Specialist skills: Are specialist skills needed (e.g., vibration analysis, control tuning)?
    • Training: How will staff be trained and kept current?
    • Contract support: Which tasks are performed in-house vs. outsourced? Outsourcing maintenance can provide specialist skills without permanent staff, but it reduces direct control and may increase coordination effort. The decision depends on the criticality of the task, the availability of in-house skills, and cost.

    For small plants, staff may wear multiple hats. Clarity of roles and responsibilities is still essential.

    Maintenance Strategies

    Comparison of maintenance strategies for industrial plants

    There are four main maintenance strategies. Most plants use a combination.

    Strategy Description Advantages Disadvantages
    Reactive (run-to-failure) Repair after failure Low cost for non-critical items High risk, high cost for critical items
    Preventive (time-based) Scheduled maintenance at fixed intervals Predictable, simple May over- or under-maintain
    Predictive (condition-based) Maintenance based on condition monitoring Optimized, reduces unnecessary work Requires monitoring equipment and skills
    Proactive (reliability-centered) Design and maintenance to prevent failures Long-term reliability Requires analysis and commitment

    For small to medium-scale plants, a mix of preventive and predictive maintenance is often the most practical approach. Reactive maintenance is acceptable only for non-critical, low-cost items.

    Preventive Maintenance

    Preventive maintenance is scheduled maintenance performed at fixed intervals, regardless of equipment condition.

    Common preventive tasks:

    • Lubrication
    • Filter replacement
    • Inspection and cleaning
    • Calibration
    • Bolt tightening
    • Vibration checks

    Key considerations:

    • Intervals: Based on manufacturer recommendations, operating experience, and criticality.
    • Scheduling: Coordinated with production to minimize disruption.
    • Documentation: Records of tasks performed, findings, and actions taken. Most plants use a computerized maintenance management system (CMMS) to plan, schedule, and track maintenance activities. A CMMS stores equipment records, maintenance histories, work orders, and spare parts inventory.
    • Effectiveness: Intervals should be reviewed and adjusted based on experience.

    Preventive maintenance is the foundation of most O&M programs, but it can be over- or under-applied if intervals are not reviewed.

    Predictive Maintenance

    Predictive maintenance uses condition monitoring to detect problems before they cause failure. Maintenance is performed only when needed, based on actual equipment condition.

    Common predictive techniques:

    Technique What It Detects Typical Applications
    Vibration analysis Bearing wear, imbalance, misalignment Rotating equipment
    Thermography Hot spots, electrical faults Electrical panels, bearings
    Oil analysis Wear particles, contamination Gearboxes, engines, turbines
    Ultrasonic testing Leaks, thickness loss Piping, tanks, vessels
    Performance monitoring Efficiency loss, fouling Heat exchangers, compressors

    Predictive maintenance requires:

    • Monitoring equipment: Sensors, instruments, and data collection systems.
    • Analysis skills: Personnel trained to interpret data.
    • Baselines: Reference data to compare against.
    • Action procedures: What to do when a problem is detected.

    For small plants, predictive maintenance may be applied selectively to critical equipment only.

    Condition Monitoring

    Key condition monitoring parameters for industrial plants

    Condition monitoring is the foundation of predictive maintenance. It involves measuring equipment parameters to detect changes that indicate developing problems.

    Key parameters to monitor:

    • Vibration: Indicates bearing wear, imbalance, misalignment, looseness.
    • Temperature: Indicates overheating, lubrication problems, electrical faults.
    • Pressure: Indicates blockages, leaks, valve problems.
    • Flow: Indicates fouling, blockages, pump problems.
    • Oil condition: Indicates wear, contamination, degradation.
    • Performance: Indicates efficiency loss, fouling, degradation.

    Monitoring approaches:

    • Manual: Periodic readings by operators or technicians.
    • Semi-automated: Portable instruments with data logging.
    • Automated: Permanently installed sensors with continuous monitoring.

    For small plants, manual and semi-automated approaches are often sufficient for non-critical equipment. Critical equipment may justify automated monitoring.

    Spare Parts Management

    Spare parts management ensures that the right parts are available when needed, without tying up excessive capital in inventory.

    Key considerations:

    • Criticality: Which parts are critical to operation? Which can wait?
    • Lead time: How long does it take to obtain each part?
    • Cost: What is the cost of the part vs. the cost of downtime?
    • Storage: Where will parts be stored, and under what conditions?
    • Obsolescence: Will parts become unavailable over time?

    Spare parts categories:

    • Consumables: Used regularly, low cost (filters, lubricants).
    • Critical spares: Essential for operation, may have long lead times.
    • Insurance spares: High-cost items held in case of failure.
    • Rotables: Components that are swapped out and repaired.

    For small plants, a focused spare parts strategy is essential. Stocking everything is expensive; stocking nothing risks extended downtime.

    Performance Monitoring and Optimization

    O&M is not just about keeping equipment running. It is also about keeping the plant performing at its best.

    Key performance indicators (KPIs):

    • Availability: Percentage of time the plant is available for operation.
    • Reliability: Frequency of forced outages.
    • Heat rate: Efficiency of fuel conversion.
    • Output: Actual vs. design output.
    • Maintenance cost: Cost per unit of output.
    • Safety: Recordable incidents, lost-time injuries.

    KPIs should have targets based on design values, industry benchmarks, or historical performance. Targets should be challenging but achievable, and reviewed periodically.

    Optimization opportunities:

    • Operating practices: Adjusting setpoints, load allocation, startup/shutdown procedures.
    • Maintenance practices: Adjusting intervals, improving procedures.
    • Equipment upgrades: Replacing or modifying equipment for better performance.
    • Control tuning: Optimizing control loops for stability and efficiency.

    Performance monitoring helps identify where improvements are possible and whether changes are effective.

    Safety in O&M

    Safety is not separate from O&M. It is part of every task.

    Key safety considerations:

    • Permit-to-work systems: For hazardous tasks.
    • Lockout/tagout: For equipment isolation.
    • Personal protective equipment (PPE): Appropriate for each task.
    • Training: Regular safety training for all staff.
    • Incident reporting: Reporting and investigating all incidents and near-misses.
    • Safety culture: Leadership commitment to safety at all levels.

    Safety incidents are costly—in human terms, in downtime, and in reputation. A strong safety culture is essential for long-term O&M success.

    Continuous Improvement

    O&M is not static. Equipment ages, conditions change, and new techniques become available. Continuous improvement keeps the plant performing at its best.

    Improvement approaches:

    • Root cause analysis: Investigating failures to prevent recurrence. Root cause analysis (RCA) is a structured process for investigating failures to identify underlying causes and prevent recurrence. Common methods include 5 Whys, fishbone diagrams, and fault tree analysis.
    • Reliability-centered maintenance (RCM): Analyzing equipment functions and failure modes to optimize maintenance.
    • Benchmarking: Comparing performance against similar plants.
    • Lessons learned: Capturing and applying lessons from projects and operations.
    • Training and development: Keeping staff skills current.

    Continuous improvement requires commitment from leadership and engagement from staff. It is not a one-time project but an ongoing practice.

    Common Mistakes in O&M

    Even experienced operators make mistakes. Common ones include:

    • Neglecting preventive maintenance: Leading to premature failures.
    • Over-maintaining: Performing unnecessary tasks that add cost without benefit.
    • Ignoring condition monitoring data: Missing early warning signs.
    • Insufficient spare parts: Leading to extended downtime.
    • Poor documentation: Making troubleshooting and improvement difficult.
    • Weak safety culture: Leading to incidents and injuries.
    • No continuous improvement: Letting performance degrade over time.

    These mistakes are costly to correct once they become habits. They are much cheaper to avoid through good planning and discipline.

    How Japanese EPC Firms Approach O&M

    Japanese engineering firms are known for their disciplined approach to O&M. Common characteristics include:

    • Thorough planning: Maintenance plans, spare parts strategies, and training programs are developed early.
    • Detailed documentation: Records of maintenance, inspections, and performance are carefully maintained.
    • Discipline in execution: Procedures are followed consistently.
    • Continuous improvement: Lessons are captured and applied.
    • Long-term focus: O&M is treated as a long-term commitment, not a short-term cost.

    For plant owners, this often means higher availability, lower maintenance costs, and longer equipment life.

    How to Evaluate O&M Readiness

    When reviewing O&M readiness, ask:

    Question Why It Matters
    Is there a clear O&M organization? Ensures accountability
    Are maintenance strategies defined? Balances preventive, predictive, and reactive
    Is condition monitoring in place? Detects problems before failure
    Is spare parts management planned? Ensures parts are available when needed
    Are KPIs defined and tracked? Measures performance and identifies improvement
    Is safety embedded in O&M? Protects people and assets
    Is continuous improvement practiced? Keeps performance from degrading

    A plant that addresses these questions is likely to perform reliably and efficiently over its life.

    Key Takeaways

    • O&M determines long-term plant availability, efficiency, and cost
    • Maintenance strategies include reactive, preventive, predictive, and proactive
    • Condition monitoring detects problems before failure
    • Spare parts management balances criticality, lead time, and cost
    • KPIs measure performance and identify improvement opportunities
    • Safety must be embedded in every O&M task
    • Japanese EPC firms emphasize thorough planning and disciplined execution

    Conclusion

    Operations and maintenance determine whether a plant delivers on its design promise. For small to medium-scale industrial plants, O&M deserves careful planning and disciplined execution from the day the plant starts up.

    By focusing on organization, maintenance strategies, condition monitoring, spare parts, performance monitoring, safety, and continuous improvement, owners and operators can ensure reliable, efficient, and safe operation for decades.