Every plant wants to know how it is performing. But performance numbers alone (availability, heat rate, maintenance cost) mean little without context. Is 92% availability good? Is a heat rate of 9,500 kJ/kWh competitive? Is maintenance cost per MW in line with similar plants?
Benchmarking answers these questions. It compares your plant’s performance against internal targets, historical performance, industry standards, or similar plants. It shows where you are strong, where you are weak, and where improvement is possible.
For small to medium-scale industrial plants, benchmarking is especially valuable because there are fewer resources to waste on the wrong priorities. It helps direct limited effort toward the areas with the greatest potential for improvement.
This article covers the key concepts and practices of plant benchmarking, from what to measure to how to use the results.
What Is Benchmarking?
Benchmarking is the process of comparing your plant’s performance against a reference point to identify gaps and opportunities for improvement.
The reference point can be:
- Internal: Historical performance, other units in the same plant, best-performing shift
- External: Similar plants, industry averages, best-in-class performers
- Standards: Design values, regulatory requirements, manufacturer specifications
- Targets: Goals set by management or corporate
Benchmarking is not just measurement. It is about learning and improvement. The goal is not only to know where you stand, but to do something about it.
Benchmarking also differs from simple performance monitoring. Monitoring tells you what a metric is today. Benchmarking tells you whether that value is good, why it differs from the reference, and what to do next.
Why Benchmarking Matters
| Factor | Impact of Benchmarking | Impact of No Benchmarking |
|---|---|---|
| Performance awareness | Know where you stand | Assume performance is acceptable |
| Prioritization | Focus on the biggest gaps | Spread effort evenly or randomly |
| Motivation | Clear targets drive improvement | No sense of urgency |
| Accountability | Performance is visible and tracked | Performance is not managed |
| Learning | Learn from better performers | Reinvent solutions others have found |
| Credibility | Data supports investment decisions | Decisions based on opinion |
For small plants, benchmarking helps identify which improvements will have the greatest impact.
What to Benchmark
| Category | Typical Metrics |
|---|---|
| Availability | Availability factor, forced outage rate, equivalent availability |
| Reliability | MTBF, failure rate, unplanned outage frequency |
| Efficiency | Heat rate, thermal efficiency, fuel consumption |
| Cost | Maintenance cost per MW, O&M cost per MWh, total cost of ownership |
| Safety | Lost-time injury rate, recordable incident rate, near-miss reporting |
| Environmental | Emissions per MWh, water consumption, waste generation |
| Maintenance | PM compliance, backlog, wrench time, schedule adherence |
| Spares | Inventory turnover, stockout rate, obsolescence |
| Staffing | Staff per MW, overtime rate, training hours per employee |
Not every plant needs to benchmark everything. Start with the metrics that matter most for your plant’s objectives, typically a handful covering availability, efficiency, cost, and safety.
Define Each Metric Precisely
Two plants can report “availability” or “heat rate” and mean different things. Before comparing, agree on definitions and boundaries:
- Availability: Is it availability factor, equivalent availability factor, or service factor? Are planned outages included or excluded? Many power-sector benchmarks follow standard definitions such as IEEE Std 762 and the NERC GADS data reporting conventions. Using them makes external comparison far easier.
- Heat rate: Is it gross or net (after auxiliary power)? Is it based on lower heating value (LHV) or higher heating value (HHV)? The difference is several percent for natural gas, enough to hide or create an apparent gap.
- Maintenance cost: Does it include labor, contractors, materials, and major overhauls? Does it include capital projects or only expensed work?
- Staffing: Does it include contractors, security, and administration?
Document each definition once and apply it consistently. A benchmark with unclear definitions is worse than none because it can point effort in the wrong direction.
Leading vs. Lagging Indicators
Benchmarks fall into two groups.
- Lagging indicators measure what has already happened. Examples: forced outage rate, availability, lost-time injury rate, maintenance cost per MWh. They confirm results but arrive too late to prevent them.
- Leading indicators predict future performance. Examples: PM compliance, maintenance backlog, near-miss reporting, training hours, condition-monitoring alert response time. They show whether the conditions for good performance are in place.
| Type | Examples | Strength | Limitation |
|---|---|---|---|
| Lagging | Forced outage rate, availability, injury rate, heat rate | Objective measure of results | Reports problems after they occur |
| Leading | PM compliance, backlog, near-miss reports, training hours | Allows early action | Link to results must be validated |
A balanced set of both provides a fuller picture. For example, a falling PM compliance rate (leading) often precedes a rise in forced outages (lagging). Tracking only lagging indicators means you learn about problems after they have cost you money.
Types of Benchmarking
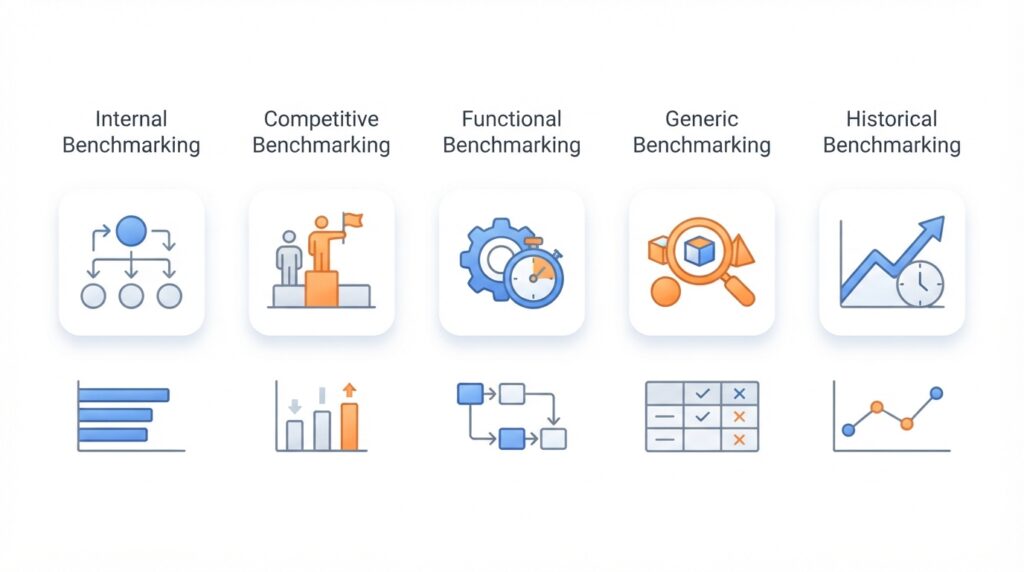
| Type | Description | Example |
|---|---|---|
| Internal | Comparing within your own organization | Unit 1 vs. Unit 2; Shift A vs. Shift B |
| Competitive | Comparing against direct competitors or similar plants | Your plant vs. a similar plant nearby |
| Functional | Comparing similar functions across industries | Your maintenance vs. best-in-class maintenance |
| Generic | Comparing processes against world-class performance regardless of industry | Your safety management vs. the best safety performers anywhere |
| Historical | Comparing against your own past performance | This year vs. last year |
Historical benchmarking is technically a form of internal benchmarking, but it is listed separately because it is so widely used. For most small plants, internal and historical benchmarking are the easiest to start with. Competitive and functional benchmarking require access to external data.
Setting the Reference Point
The reference point determines what “good” looks like.
| Reference Point | Description | When to Use |
|---|---|---|
| Design value | What the plant was designed to achieve | When design data is reliable; adjust for age and degradation |
| Historical best | Your best performance in the past | To identify what is achievable |
| Industry average | Typical performance for similar plants | To gauge competitiveness |
| Best-in-class | The best performance achieved by any plant | To set aspirational targets |
| Regulatory minimum | Minimum required by law or permit | To ensure compliance |
| Management target | Goal set by management | To align with business objectives |
Using multiple reference points provides a fuller picture. Comparing against both industry average and best-in-class shows where you stand and where you could be. Be cautious with design values on older plants: equipment degrades, so a plant that is 20 years old may never return to its original heat rate, and a gap to design may not be recoverable.
Data Collection and Quality
Benchmarking depends on good data. Poor data leads to wrong conclusions.
Data quality requirements:
- Accuracy: Data reflects actual performance.
- Completeness: All relevant data is captured.
- Consistency: Data is collected the same way over time.
- Timeliness: Data is available when needed.
- Traceability: Data can be traced to its source.
Data sources:
- Control systems/historian: Operating data, performance trends
- CMMS: Maintenance records, work orders, costs
- Production records: Output, downtime, quality
- Safety records: Incidents, near-misses, training
- Financial records: Costs, budgets, expenditures
Data should be validated before use. Check instrument calibration for key measurements such as fuel flow and generator output, since a small meter error can create a false efficiency gap. A common mistake is to benchmark against data that is incomplete or inconsistent, such as a CMMS in which work orders are not closed out or costs are not charged to the right equipment.
Normalizing Data for Comparison
Plants differ in size, age, technology, and operating conditions. To compare fairly, data must be normalized.
Common normalization factors:
- Per MW: Cost or consumption per megawatt of installed capacity.
- Per MWh: Cost or consumption per megawatt-hour of output.
- Per operating hour: Cost or consumption per hour of operation.
- Per unit of production: Cost or consumption per unit of product.
- Capacity factor: Actual output as a percentage of the output possible at full rated capacity over the same period. It is often used to group plants with similar operating patterns, since baseload and peaking plants should not be compared directly.
- Ambient and fuel corrections: Performance corrected to reference conditions for temperature, altitude, humidity, and fuel quality.
Without normalization, comparisons can be misleading. A plant with twice the capacity will have higher absolute costs but may be more efficient per MW. Likewise, a gas turbine running at partial load or in hot weather will show a worse heat rate than the same machine at full load on a cool day, even though nothing is wrong.
Internal Benchmarking
Internal benchmarking compares performance within your own organization.
Examples:
- Unit-to-unit: How does Unit 1 compare to Unit 2?
- Shift-to-shift: How does Shift A compare to Shift B?
- Year-to-year: How does this year compare to last year?
- Department-to-department: How does maintenance compare to operations?
Internal benchmarking is often the easiest place to start because the data is already available and the comparison is fair.
Benefits:
- No external data required.
- Directly comparable.
- Identifies internal best practices.
- Builds healthy internal competition and motivation.
Limitation: It can only show you the best you already do. If the whole plant is below industry standards, internal benchmarking will not reveal it.
External Benchmarking
External benchmarking compares your performance against other plants.
Sources of external data:
- Industry associations: Many industries publish benchmarking data.
- Consultants: Firms that specialize in benchmarking.
- Peer networks: Groups of plants that share data.
- Published studies: Research and industry reports.
- Equipment vendors and OEM user groups: Performance data from similar installations.
Challenges:
- Data may not be directly comparable.
- Confidentiality concerns.
- Cost of access.
- Different definitions and boundaries.
External benchmarking requires careful interpretation. Differences in plant age, technology, fuel, and operating conditions must be considered.
If you exchange data directly with competitors, take care with commercially sensitive information such as pricing, contract terms, and future plans. Competition law in many jurisdictions restricts such exchanges. Use a neutral third party (an association or consultant) to aggregate and anonymize data, and obtain legal advice where in doubt.
The Value of Peer Networks
Peer networks (formal or informal groups of similar plants) can provide benchmarking data that is more relevant than broad industry averages. Many industries have established peer groups that share performance data confidentially. For small plants, a peer group of five to ten similar facilities often yields more useful comparisons than a large database dominated by plants of a different size or technology. Peer groups also provide something a database cannot: the chance to ask the better performer how they achieved their results.
Analyzing Gaps
The purpose of benchmarking is to identify gaps and understand why they exist.
Gap analysis questions:
- Where are we significantly better or worse than the reference?
- Why is the gap there? What causes it?
- Is the gap due to design, operation, maintenance, or external factors?
- What would it take to close the gap?
- Is closing the gap worth the investment?
Not all gaps need to be closed. Some are due to factors outside your control, such as plant age, location, or fuel quality. Focus on gaps that are both significant and addressable.
Worked Example
A 50 MW net plant operates at a 70% capacity factor. Its net heat rate (LHV basis) is 9,500 kJ/kWh. A peer-group benchmark for similar plants, on the same basis and corrected to the same conditions, is 9,000 kJ/kWh.
- Efficiency: 3,600 ÷ 9,500 = 37.9% versus 3,600 ÷ 9,000 = 40.0%.
- Gap: 500 kJ/kWh, or about 5.6% more fuel per kWh.
- Annual output: 50 MW × 8,760 h × 0.70 = 306,600 MWh.
- Excess fuel energy: 306,600,000 kWh × 500 kJ/kWh ≈ 153,300 GJ per year.
- Cost: At an assumed fuel price of USD 8 per GJ, the gap is worth about USD 1.2 million per year.
That figure tells the plant how much it can reasonably spend to investigate and close the gap, for example on condenser or heat exchanger cleaning, turbine inspection, instrument calibration, or operating-mode changes. Part of the gap may be unrecoverable (age, design), so the investigation should separate the recoverable portion from the rest.
A similar view applies to availability. The difference between 92% and 95% availability is 3 percentage points, or about 263 hours per year of additional generation capability.
Using Benchmarking Results
Benchmarking is only valuable if it leads to action.
Steps to use benchmarking results:
- Identify the biggest gaps: Where is performance significantly below the reference?
- Investigate causes: Why is the gap there?
- Prioritize opportunities: Which gaps offer the greatest improvement potential for the effort?
- Set improvement targets: What performance is achievable, and by when?
- Develop action plans: What changes are needed, who owns them, and what do they cost?
- Implement and monitor: Track progress and adjust as needed.
Benchmarking should be part of a continuous improvement cycle, not a one-time study.
Benchmarking Frequency
Benchmarking frequency depends on the metric and the rate of change. Some metrics, such as safety and availability, are reviewed monthly or quarterly. Others, such as heat rate and maintenance cost, are typically benchmarked formally once a year, although heat rate is often trended monthly through performance monitoring so that degradation is caught early. The key is consistency: benchmark at the same interval each time, using the same definitions, so that results are comparable.
| Metric Type | Typical Review Interval |
|---|---|
| Safety, near-miss reporting | Monthly |
| Availability, forced outage rate | Monthly or quarterly |
| PM compliance, backlog | Monthly |
| Heat rate / efficiency | Monthly trending; annual formal benchmark |
| Maintenance and O&M cost | Quarterly trending; annual formal benchmark |
| Staffing, spares performance | Annually |
| External benchmark study | Annually or every two to three years |
Communicating Benchmark Results
Benchmarking results can be sensitive. They should be communicated carefully. The purpose is improvement, not blame. Sharing results transparently, along with the plan to address gaps, builds trust and motivation. Present gaps as opportunities, credit teams that perform well, and keep the presentation simple: a one-page dashboard showing each key metric, its reference, the gap, and the action under way is usually more effective than a long report. People who feel that benchmarking is being used to judge them will tend to hide problems or manipulate data, which defeats the purpose.
Common Pitfalls in Benchmarking
Even experienced organizations make mistakes. Common ones include:
- Comparing apples to oranges: Plants with different sizes, ages, technologies, or definitions.
- Using poor data: Incomplete or inconsistent data leads to wrong conclusions.
- Focusing only on numbers: Missing the context and causes behind the numbers.
- Not normalizing: Comparing absolute values without adjusting for size or operating conditions.
- Making excuses: Attributing every gap to factors outside your control without testing the assumption.
- No follow-through: Benchmarking without action.
- Benchmarking too much: Trying to measure everything instead of what matters.
- Benchmarking too little: Tracking only one or two metrics, or only lagging indicators, and missing important problems.
- Chasing the metric: Optimizing the number rather than the performance, for example deferring maintenance to meet a cost target.
- Inconsistent intervals or definitions: Changing the method from year to year so trends cannot be trusted.
These pitfalls reduce the value of benchmarking and can lead to wrong decisions.
Benchmarking in Small Plants
Small plants face particular challenges with benchmarking.
Challenges:
- Limited data.
- Fewer resources for benchmarking.
- Less access to external data.
- Difficulty finding comparable plants.
Practical approaches:
- Start with internal benchmarking: Compare units, shifts, or years.
- Focus on a few key metrics: For example availability, heat rate, maintenance cost, and safety, with one or two leading indicators.
- Use industry associations: Many provide benchmarking data for their members.
- Join peer networks: Share data with similar plants.
- Use simple tools: Spreadsheets are often sufficient.
- Build a baseline: Establish your own historical performance as a reference.
- Improve incrementally: Small improvements add up.
Small plants can benefit from benchmarking without a large investment.
A Practical Starting Plan
- Month 1: Choose five to eight metrics, write down their definitions, and assign an owner for each.
- Month 2: Collect two to three years of historical data and validate it. Calculate your baseline.
- Month 3: Find at least one external reference (association data, peer group, or vendor data) and compare on a normalized basis.
- Month 4: Analyze the largest gaps, estimate their value, and select two or three for action.
- Ongoing: Review monthly or quarterly, repeat the full benchmark annually, and update targets as performance improves.
Benchmarking and Continuous Improvement
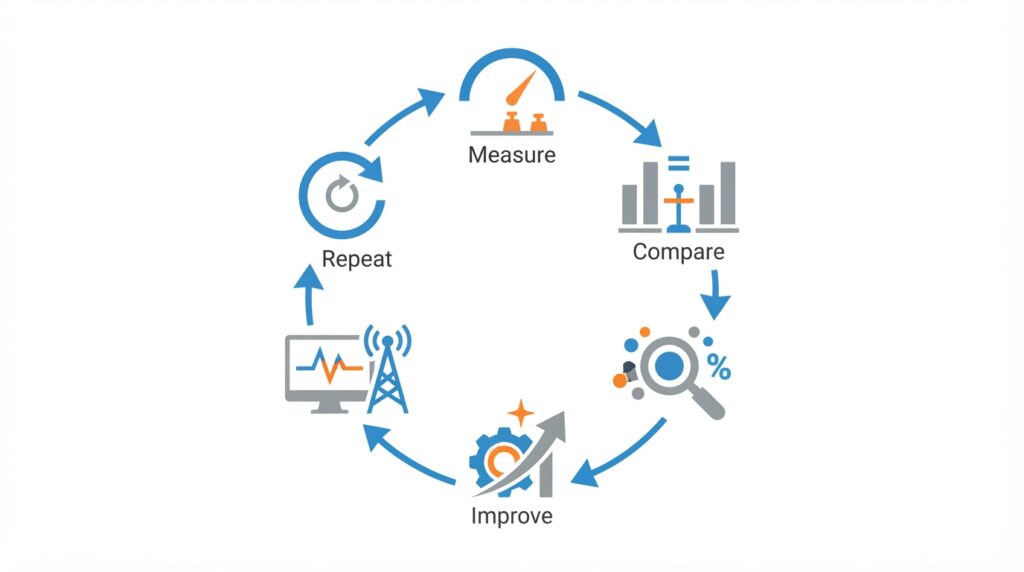
Benchmarking is most effective as part of a continuous improvement cycle.
The cycle:
- Measure: Collect performance data.
- Compare: Benchmark against reference points.
- Analyze: Identify gaps and their causes.
- Improve: Implement changes to close gaps.
- Monitor: Track progress and verify improvement.
- Repeat: Continue the cycle.
Each cycle should lead to measurable improvement. Over time, the plant’s performance improves and the reference points may need to be updated.
How Japanese EPC Firms Approach Benchmarking
Japanese engineering firms are known for their disciplined approach to performance management. Common characteristics include:
- Systematic measurement: Performance is measured consistently and accurately.
- Clear targets: Targets are set based on benchmarks and objectives.
- Detailed analysis: Gaps are investigated thoroughly.
- Disciplined execution: Improvement plans are implemented consistently.
- Continuous improvement: Benchmarking is part of an ongoing cycle, in the spirit of kaizen.
- Long-term focus: Improvement is sustained over time.
For plant owners, this often means plants that continuously improve and remain competitive.
How to Evaluate Benchmarking Readiness
| Question | Why It Matters |
|---|---|
| Are key metrics defined? | You cannot benchmark what you do not measure |
| Are definitions and boundaries documented? | Ensures like-for-like comparison |
| Is data accurate and consistent? | Poor data leads to wrong conclusions |
| Is data normalized for comparison? | Ensures fair comparison |
| Is there a mix of leading and lagging indicators? | Gives early warning as well as results |
| Is there a reference point? | Defines what “good” looks like |
| Is there a process for analyzing gaps? | Turns data into insight |
| Are results communicated constructively? | Builds trust and encourages honest data |
| Is there follow-through on findings? | Benchmarking without action is wasted effort |
| Is benchmarking part of continuous improvement? | Sustains improvement over time |
A plant that addresses these questions is ready to benefit from benchmarking.
Conclusion
Benchmarking provides context for performance and direction for improvement. It helps plants understand where they stand, identify gaps, and focus effort where it matters most.
For small to medium-scale industrial plants, benchmarking is especially valuable because resources are limited. By measuring key metrics, comparing against meaningful references, analyzing gaps, and taking action, plants can improve performance and remain competitive.
Key Takeaways
- Benchmarking compares performance against a reference point to identify gaps.
- What to benchmark includes availability, reliability, efficiency, cost, safety, environmental, maintenance, spares, and staffing.
- Types include internal, competitive, functional, generic, and historical.
- Define metrics precisely (for example gross vs. net, LHV vs. HHV) so comparisons are like for like.
- Data must be accurate, consistent, and normalized for fair comparison.
- Use a balance of lagging indicators (results) and leading indicators (predictors).
- Peer networks often provide more relevant data than broad industry averages.
- Gap analysis identifies where performance is below the reference and why.
- Benchmark at consistent intervals, and communicate results constructively, for improvement and not blame.
- Benchmarking is only valuable if it leads to action, as part of a continuous improvement cycle.
- Japanese EPC firms emphasize systematic measurement and disciplined execution.