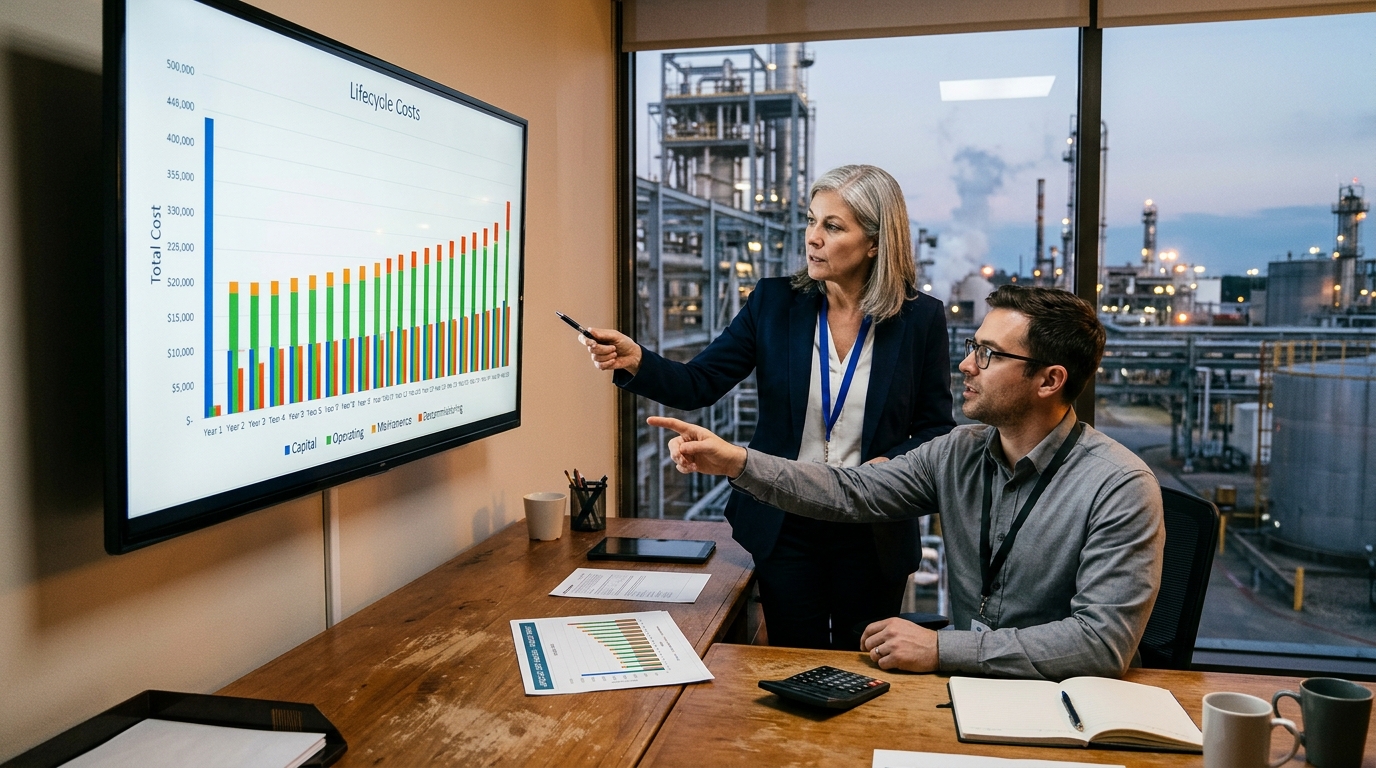
Every plant has a price. But the purchase price, meaning the capital cost of design and construction, is only part of what the plant will cost over its life. There is also the cost of operating it, maintaining it, supplying it with fuel and consumables, and eventually decommissioning it. Taken together, these are the lifecycle cost.
Lifecycle costing is the discipline of evaluating all costs associated with a plant over its entire life, not just the initial capital cost. It compares alternatives on a like-for-like basis, so that decisions are based on total cost rather than first cost.
For small to medium-scale industrial plants, lifecycle costing is especially important because capital is limited and every decision has long-term consequences. A cheaper plant that costs more to run is not a better plant. A more expensive plant that runs efficiently for decades may be the better investment.
This article covers the key practices in plant lifecycle costing, from cost components to analysis methods and decision-making.
What Is Lifecycle Costing?
Lifecycle costing is the process of evaluating the total cost of an asset over its entire life. It includes:
- Capital costs: Design, construction, and equipment.
- Operating costs: Fuel, power, water, consumables, staff, insurance, and fees.
- Maintenance costs: Inspection, repair, and replacement.
- Downtime costs: Lost production from outages.
- Decommissioning costs: Shutdown, dismantling, and site restoration.
- Residual value: Value at the end of life.
Lifecycle costing is also called whole-life costing or total cost of ownership (TCO). Recognized references include ISO 15686-5 (life cycle costing of constructed assets), IEC 60300-3-3 (life cycle costing for dependability), and the ISO 55000 family on asset management.
Why Lifecycle Costing Matters
Lifecycle costing directly affects investment decisions. It is most powerful early in a project, during concept and FEED, because the decisions that lock in most of the lifecycle cost (technology, configuration, efficiency, materials, redundancy) are made long before construction starts. Changing them later is expensive.
| Factor | Impact of Good Lifecycle Costing | Impact of Poor Lifecycle Costing |
|---|---|---|
| Investment | Best value selected | Poor value selected |
| Operating cost | Lower over plant life | Higher over plant life |
| Reliability | Equipment selected for reliability | Failures and downtime |
| Sustainability | Efficient, sustainable choices | Wasteful, unsustainable choices |
| Risk | Risks understood and priced | Risks underestimated |
For small plants, where capital is limited, lifecycle costing determines whether the plant is a good investment.
Cost Components
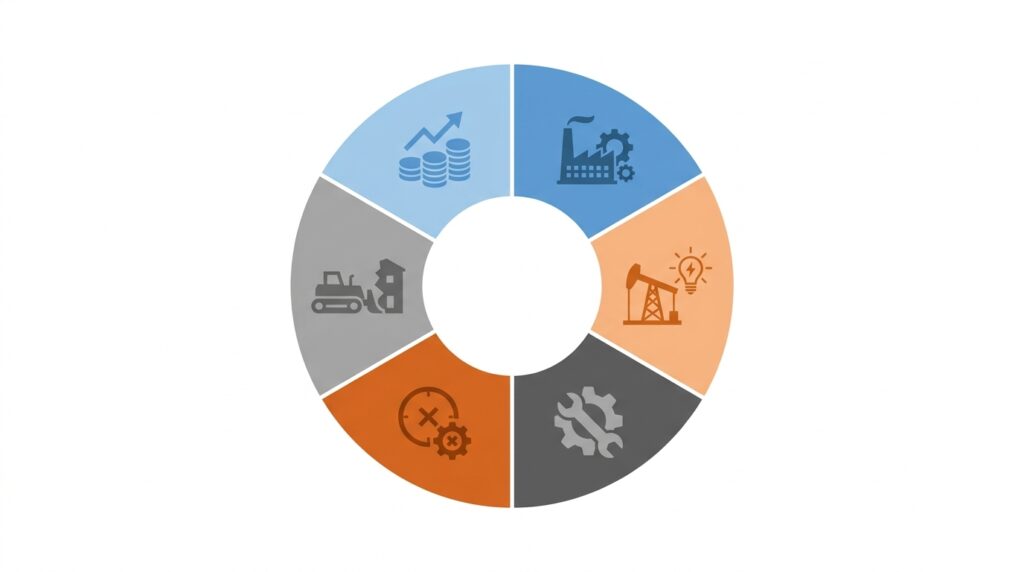
Lifecycle costs fall into several categories.
| Component | Description | Typical Share (thermal plants) |
|---|---|---|
| Capital cost | Design, construction, equipment | 20–40% |
| Fuel/energy cost | Fuel, power, and consumables | 40–70% |
| Maintenance cost | Inspection, repair, replacement | 5–15% |
| Downtime cost | Lost production | Varies |
| Decommissioning cost | Shutdown, dismantling, restoration | 1–5% |
| Residual value | Value at end of life | Offset |
The shares vary widely by plant type, capacity factor, and fuel price. For most thermal plants, fuel and energy costs dominate. For plants with no fuel cost, such as solar, wind, or hydro, capital cost is usually the largest share and the profile is very different.
Capital Costs
Capital costs include all costs to design, build, and commission the plant:
- Engineering: Design and engineering services.
- Equipment: Major equipment and bulk materials.
- Construction: Labor, equipment, and construction services.
- Project management: Project management and administration.
- Owner’s costs: Land, permits, insurance, financing, and interest during construction.
- Contingency: Reserve for unknowns.
Capital costs are usually the most visible, but they are often a minority of lifecycle cost.
Operating Costs
Operating costs include all costs to run the plant:
- Fuel: The largest operating cost for most thermal plants.
- Power: Electricity for auxiliaries and equipment.
- Water: Water supply and treatment.
- Consumables: Chemicals, lubricants, and other consumables.
- Staff: Operating staff (maintenance staff may be counted here or under maintenance, but never both).
- Insurance: Property and liability insurance.
- Taxes and fees: Property taxes, permits, and fees.
Operating costs recur every year and accumulate over the plant’s life. Fuel and power costs depend on plant efficiency, so heat rate and part-load performance are direct lifecycle cost drivers.
Maintenance Costs
Maintenance costs include all costs to keep the plant in working condition:
- Preventive maintenance: Scheduled maintenance tasks.
- Predictive maintenance: Condition monitoring and analysis.
- Corrective maintenance: Repairs after failures.
- Overhauls: Major overhauls and inspections, which are lumpy and should be placed in the years they occur, not averaged away.
- Spare parts: Parts and materials.
- Contractor services: Specialized maintenance services.
Maintenance costs are often underestimated at the design stage, and they usually rise as equipment ages.
Downtime Costs
Downtime costs include the cost of lost production when the plant is not operating:
- Lost production: Revenue lost from outages.
- Restart costs: Cost of restarting after an outage.
- Penalties: Contractual penalties for non-delivery.
- Customer impact: Lost customers or damaged relationships.
Downtime costs can be significant, especially for plants with high output value. They link lifecycle costing directly to reliability: availability assumptions should come from reliability analysis, not from guesswork.
Decommissioning Costs
Decommissioning costs include all costs to shut down, dismantle, and restore the site:
- Shutdown: Costs of ceasing operations.
- Decontamination: Removing hazardous materials.
- Dismantling: Removing equipment and structures.
- Waste management: Handling and disposing of waste.
- Site restoration: Restoring the site to a suitable condition.
Decommissioning costs are often overlooked. Although they occur far in the future and are heavily reduced by discounting, they may still be a legal or financial-assurance obligation from day one.
Residual Value
Residual value is the value of the plant at the end of its life:
- Scrap value: Value of materials.
- Equipment value: Value of reusable equipment.
- Land value: Value of the land.
Residual value offsets the lifecycle cost. It is usually small and uncertain, so conservative estimates are advisable. If dismantling costs exceed salvage value, the net residual value is negative.
Lifecycle Costing Methods
Several methods are used to evaluate lifecycle costs.
| Method | Description | When to Use |
|---|---|---|
| Net present value (NPV) | Present value of all costs (and benefits) | Most common |
| Internal rate of return (IRR) | Discount rate at which NPV equals zero | Revenue-generating investments |
| Payback period | Time to recover investment | Simple screening |
| Levelized cost | Discounted lifetime cost per unit of output | Comparing technologies |
| Equivalent annual cost (EAC) | Annualized cost | Comparing different lives |
Each method has strengths and limitations. The choice depends on the decision being made. Note that simple payback ignores the time value of money and everything after the payback date, and IRR is meaningful only when the alternatives generate comparable revenue or savings, so neither should be the sole basis for a decision.
Net Present Value
Net present value (NPV) is the most common lifecycle costing method. The calculation:
- Identify cash flows: All costs and benefits over the plant’s life, in the year they occur.
- Select a discount rate: The rate reflecting the time value of money.
- Discount cash flows: Convert future cash flows to present value.
- Sum present values: The sum is the NPV.
When comparing alternatives that deliver the same output, the usual approach is to compute the present value of costs for each. The alternative with the lowest present value of cost is the best value. When benefits are included, a positive NPV indicates a good investment, and a higher NPV indicates better value.
Discount Rate
The discount rate reflects the time value of money. Considerations:
- Cost of capital: The cost of financing the investment.
- Risk: Higher risk justifies a higher discount rate.
- Inflation: Use real rates with real (constant-price) cash flows, and nominal rates with nominal cash flows. Never mix them.
- Opportunity cost: Alternative uses of capital.
Discount rate selection has a significant effect on lifecycle cost results. A high rate favors low-capital, high-operating-cost options, and a low rate favors efficient, capital-intensive ones.
Levelized Cost
Levelized cost is the discounted lifetime cost divided by the discounted lifetime output, giving a cost per unit (for example per MWh or per tonne). Its inputs are:
- Capital cost: Spread over the plant’s life.
- Operating cost: Annual operating costs.
- Maintenance cost: Annual maintenance costs.
- Fuel cost: Annual fuel costs.
- Output: Annual output.
Levelized cost is useful for comparing different technologies or plant configurations, especially when their outputs or capacity factors differ.
Equivalent Annual Cost
Equivalent annual cost (EAC) annualizes the lifecycle cost:
- Calculate the NPV of the lifecycle cost.
- Calculate the annuity factor: [1 − (1 + r)^−n] / r, where r is the discount rate and n is the life in years.
- Divide the NPV by the annuity factor. The result is the EAC.
EAC is useful for comparing alternatives with different lives, for example a cheaper unit that needs replacing after 10 years versus a more robust one lasting 20.
Lifecycle Costing Process
Lifecycle costing follows a structured process.
| Step | Description |
|---|---|
| 1. Define scope | What alternatives are being compared, over what analysis period? |
| 2. Identify costs | What costs are associated with each alternative? |
| 3. Estimate costs | What is the magnitude and timing of each cost? |
| 4. Select method | Which method is appropriate? |
| 5. Perform analysis | Calculate the lifecycle cost. |
| 6. Test results | Sensitivity and risk analysis. |
| 7. Interpret results | What do the results mean? |
| 8. Make decision | Which alternative is best? |
The process should be transparent and documented.
A Simple Illustration
The figures below are illustrative only. Suppose two equipment options must serve a 20-year life at a real discount rate of 8%:
| Option A (standard) | Option B (high efficiency) | |
|---|---|---|
| Capital cost | 10.0 million | 12.0 million |
| Annual fuel and operating cost | 2.0 million | 1.7 million |
| Annual maintenance cost | 0.3 million | 0.3 million |
| Annual cost | 2.3 million | 2.0 million |
| Present value of annual costs (annuity factor 9.82) | 22.6 million | 19.6 million |
| Lifecycle cost (NPV of costs) | 32.6 million | 31.6 million |
Option B costs 2 million more up front but is about 1 million cheaper over the plant’s life. Now test the discount rate. At 15% (annuity factor about 6.26), Option A comes to about 24.4 million and Option B to about 24.5 million, so the ranking reverses. The decision is sensitive to the discount rate, which is exactly why sensitivity analysis matters.
Comparing Alternatives
Lifecycle costing is most valuable when comparing alternatives.
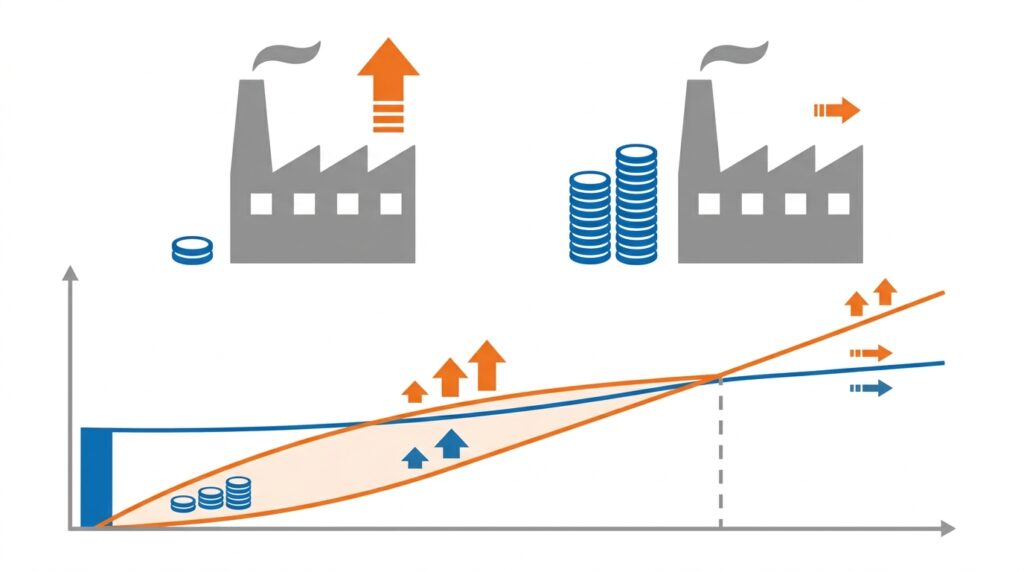
Common comparisons:
- Equipment options: Different equipment with different capital and operating costs.
- Design options: Different designs with different efficiency.
- Fuel options: Different fuels with different costs and emissions.
- Location options: Different sites with different costs.
- Build vs. buy: Building a new plant vs. purchasing an existing one.
Comparisons should be on a like-for-like basis, considering all costs over the same period, with the same assumptions and the same level of output and reliability.
Comparing Technologies
Lifecycle costing is particularly valuable for comparing different technologies, for example combined cycle versus simple cycle, or different renewable options. It allows technologies with different capital and operating cost profiles to be compared on a common basis. A simple-cycle plant, for instance, has lower capital cost but higher fuel cost per unit of output than combined cycle, and only a lifecycle analysis at the expected operating hours shows which is cheaper overall.
Assumptions, Sensitivity, and Risk
The Role of Assumptions
Lifecycle costing is only as good as its assumptions. Key assumptions (fuel price, discount rate, operating hours, maintenance cost, plant life) should be documented, justified, and tested through sensitivity analysis. Other assumptions worth recording include escalation rates, degradation of efficiency over time, the analysis period, and the price basis (real or nominal).
Sensitivity Analysis
Sensitivity analysis tests how lifecycle cost results change when key assumptions (fuel price, discount rate, operating hours, maintenance cost) are varied. It identifies which assumptions have the greatest effect on the outcome and helps decision-makers understand the robustness of the analysis. Common approaches include:
- One-at-a-time variation: Change one input and see the effect, often shown in a tornado chart.
- Scenario analysis: Test coherent combinations, such as high fuel price with low operating hours.
- Break-even analysis: Find the value at which the preferred alternative changes.
Risk-Adjusted Lifecycle Costing
Risk-adjusted lifecycle costing incorporates the probability and impact of uncertain events (fuel price volatility, equipment failure, regulatory changes) into the analysis. This provides a more realistic picture of expected cost than a single-point estimate. Methods range from simple risk allowances and probability-weighted scenarios to Monte Carlo simulation, which produces a range of outcomes rather than one number.
Lifecycle Costing in Small Plants
Small plants face particular challenges with lifecycle costing:
- Fewer resources for detailed analysis.
- Less data on operating and maintenance costs.
- Competing priorities.
- Short-term focus.
Practical approaches:
- Focus on major costs: Fuel, energy, and maintenance.
- Use simple tools: Spreadsheets are often sufficient.
- Use industry data: Benchmarks, vendor data, and published data can fill gaps.
- Be conservative: Use conservative assumptions.
- Consider sensitivity: Test how results change with different assumptions.
- Document assumptions: Record the basis for the analysis.
Lifecycle costing does not need to be complex. It needs to be thoughtful.
Common Mistakes in Lifecycle Costing
Even experienced organizations make mistakes. Common ones include:
- Focusing on capital cost: Ignoring operating and maintenance costs.
- Underestimating operating costs: Underestimating fuel, energy, and maintenance.
- Ignoring downtime: Not accounting for lost production.
- Ignoring decommissioning: Not including decommissioning costs.
- Inconsistent assumptions: Comparing alternatives with different assumptions.
- Mixing real and nominal values: Using a nominal discount rate on constant-price cash flows, or the reverse.
- Inappropriate discount rate: Using a rate that does not reflect the cost of capital.
- Ignoring risk: Not accounting for uncertainty.
- No sensitivity analysis: Not testing how results change with assumptions.
- No documentation: Not recording the basis for the analysis.
- Not feeding results back: Doing the analysis once and never updating it with actual operating data.
These mistakes are costly to correct. They are much cheaper to avoid through disciplined lifecycle costing.
How Japanese EPC Firms Approach Lifecycle Costing
Japanese engineering firms are known for their disciplined approach to lifecycle costing. Common characteristics include:
- Long-term focus: Lifecycle cost is considered from the beginning.
- Thorough analysis: All costs are identified and estimated.
- Conservative assumptions: Assumptions are realistic, not optimistic.
- Sensitivity analysis: Results are tested against different assumptions.
- Detailed documentation: The analysis is documented and transparent.
- Continuous improvement: Lessons are captured and applied.
For plant owners, this often means decisions that deliver the best long-term value.
How to Evaluate Lifecycle Costing Readiness
When reviewing lifecycle costing, ask:
| Question | Why It Matters |
|---|---|
| Is lifecycle costing performed? | Ensures decisions are based on total cost |
| Are all cost components included? | Prevents overlooking significant costs |
| Are costs estimated realistically? | Ensures results are meaningful |
| Is the discount rate appropriate, and are real and nominal values used consistently? | Ensures results reflect the time value of money |
| Are alternatives compared on a like-for-like basis? | Ensures fair comparison |
| Is sensitivity analysis performed? | Tests how results change with assumptions |
| Is risk considered? | Accounts for uncertainty |
| Are assumptions documented? | Ensures transparency and traceability |
| Is the analysis used in decisions and updated with actual data? | Ensures lifecycle costing informs decisions |
A plant that addresses these questions is ready for effective lifecycle costing.
Conclusion
Lifecycle costing is critical to plant investment decisions. For small to medium-scale industrial plants, it determines whether the plant is a good investment over its entire life.
By focusing on all cost components, appropriate methods, realistic assumptions, sensitivity analysis, and documentation, owners and project teams can ensure that decisions are based on total cost rather than first cost.
Key Takeaways
- Lifecycle costing evaluates all costs over the plant’s life, not just the initial capital cost.
- Cost components include capital, fuel/energy, maintenance, downtime, decommissioning, and residual value.
- For most thermal plants, fuel and energy costs dominate the lifecycle cost.
- NPV, IRR, payback period, levelized cost, and EAC are common methods, each with limitations.
- The discount rate reflects the time value of money and has a significant effect on results.
- Lifecycle costing is only as good as its assumptions, which should be documented and tested.
- Sensitivity analysis and risk-adjusted costing show how robust the results are.
- Comparisons should be on a like-for-like basis, considering all costs over the same period.
- Lifecycle costing is particularly valuable for comparing technologies with different cost profiles.
- Small plants can focus on major costs and use simple tools.
- Common mistakes include focusing on capital cost and underestimating operating costs.
- Japanese EPC firms emphasize thorough analysis and sensitivity analysis.